
News Release
U.S. International Investment Position, Fourth Quarter and Year 2019
Fourth Quarter
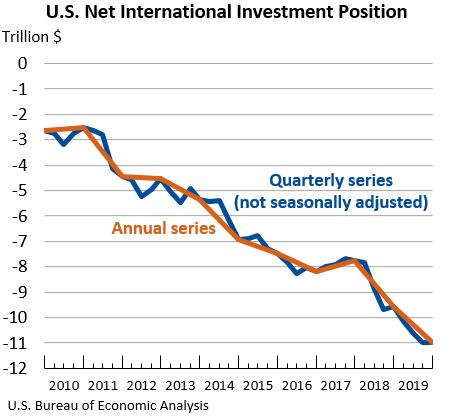
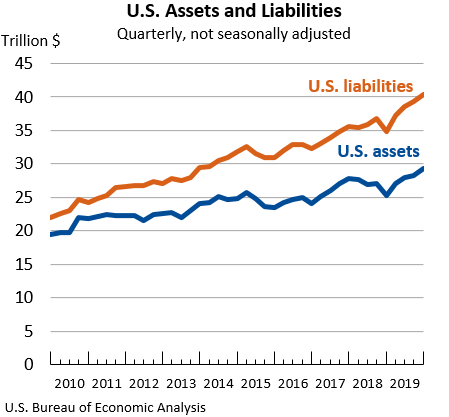
The U.S. net international investment position, the difference between U.S. residents’ foreign financial assets and liabilities, was –$10.99 trillion at the end of the fourth quarter of 2019, according to statistics released by the U.S. Bureau of Economic Analysis (BEA). Assets totaled $29.32 trillion and liabilities were $40.31 trillion.
At the end of the third quarter, the net investment position was –$10.98 trillion (Table 1).
The –$14.1 billion change in the net investment position from the third quarter to the fourth quarter came from net financial transactions of –$91.2 billion and net other changes in position, such as price and exchange rate changes, of $77.1 billion (Table A).
Table A. Quarterly Change in the U.S. Net International Investment Position
Billions of dollars, not seasonally adjusted
| Position, 2019:III |
Change in position in 2019:IV | Position, 2019:IV |
|||
| Total | Attributable to: | ||||
| Financial transactions |
Other changes in position 1 |
||||
| U.S. net international investment position | -10,977.3 | -14.1 | -91.2 | 77.1 | -10,991.4 |
| Net position excluding financial derivatives | -11,007.7 | -3.8 | -90.3 | 86.4 | -11,011.5 |
| Financial derivatives other than reserves, net | 30.4 | -10.2 | -0.9 | -9.3 | 20.2 |
| U.S. assets | 28,279.2 | 1,038.2 | (2) | (2) | 29,317.5 |
| Assets excluding financial derivatives | 26,201.0 | 1,326.1 | -24.5 | 1,350.6 | 27,527.1 |
| Financial derivatives other than reserves | 2,078.3 | -287.9 | (2) | (2) | 1,790.4 |
| U.S. liabilities | 39,256.5 | 1,052.3 | (2) | (2) | 40,308.8 |
| Liabilities excluding financial derivatives | 37,208.7 | 1,329.9 | 65.7 | 1,264.2 | 38,538.6 |
| Financial derivatives other than reserves | 2,047.9 | -277.6 | (2) | (2) | 1,770.3 |
| 1. Disaggregation of other changes in position into price changes, exchange rate changes, and other changes in volume and valuation is only presented for annual statistics released in June each year. 2. Financial transactions and other changes in financial derivatives positions are available only on a net basis; they are not separately available for U.S. assets and U.S. liabilities. |
|||||
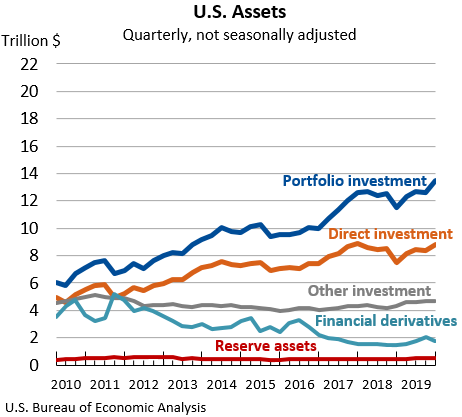
U.S. assets increased by $1.04 trillion, to a total of $29.32 trillion, at the end of the fourth quarter, mostly reflecting increases in portfolio investment and direct investment assets. Portfolio investment assets increased by $874.6 billion, to $13.51 trillion, and direct investment assets increased by $471.5 billion, to $8.84 trillion. These increases were driven mainly by foreign stock price increases and the appreciation of foreign currencies against the U.S. dollar that raised the value of these assets in dollar terms.
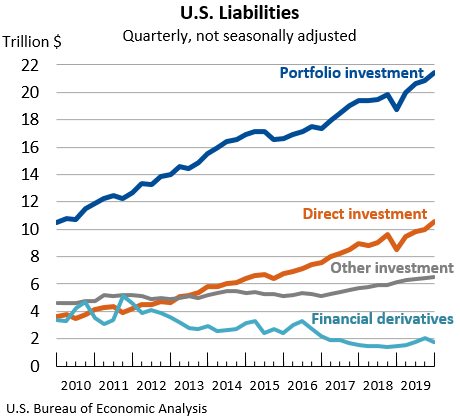
U.S. liabilities increased by $1.05 trillion, to a total of $40.31 trillion, at the end of the fourth quarter, mostly reflecting increases in direct investment and portfolio investment liabilities. Direct investment liabilities increased by $641.3 billion, to $10.58 trillion, and portfolio investment liabilities increased by $614.4 billion, to $21.48 trillion. These increases were driven mainly by U.S. stock price increases that raised the value of these liabilities.
Updates to Third Quarter 2019 International Investment Position Aggregates
Trillions of dollars, not seasonally adjusted
| Preliminary estimate | Revised estimate | |
|---|---|---|
| U.S. net international investment position | -10.95 | -10.98 |
| U.S. assets | 28.26 | 28.28 |
| U.S. liabilities | 39.21 | 39.26 |
Year 2019
The U.S. net international investment position was –$10.99 trillion at the end of 2019 compared to –$9.55 trillion at the end of 2018 (Table 1).
The –$1.44 trillion change in the net investment position from the end of 2018 to the end of 2019 came from net financial transactions of –$395.9 billion and net other changes in position, such as price and exchange rate changes, of –$1.04 trillion (Table B).
Table B. Annual Change in the U.S. Net International Investment Position
Billions of dollars
| Position, 2018 |
Change in position in 2019 | Position, 2019 |
|||
| Total | Attributable to: | ||||
| Financial transactions |
Other changes in position 1 |
||||
| U.S. net international investment position | -9,554.7 | -1,436.7 | -395.9 | -1,040.8 | -10,991.4 |
| Net position excluding financial derivatives | -9,592.4 | -1,419.1 | -357.5 | -1,061.6 | -11,011.5 |
| Financial derivatives other than reserves, net | 37.7 | -17.5 | -38.4 | 20.8 | 20.2 |
| U.S. assets | 25,241.5 | 4,076.0 | (2) | (2) | 29,317.5 |
| Assets excluding financial derivatives | 23,749.2 | 3,777.9 | 426.9 | 3,350.9 | 27,527.1 |
| Financial derivatives other than reserves | 1,492.3 | 298.1 | (2) | (2) | 1,790.4 |
| U.S. liabilities | 34,796.2 | 5,512.6 | (2) | (2) | 40,308.8 |
| Liabilities excluding financial derivatives | 33,341.6 | 5,197.0 | 784.4 | 4,412.5 | 38,538.6 |
| Financial derivatives other than reserves | 1,454.6 | 315.7 | (2) | (2) | 1,770.3 |
| 1. Disaggregation of other changes in position into price changes, exchange rate changes, and other changes in volume and valuation is only presented for annual statistics released in June each year. 2. Financial transactions and other changes in financial derivatives positions are available only on a net basis; they are not separately available for U.S. assets and U.S. liabilities. |
|||||
U.S. assets increased by $4.08 trillion, to a total of $29.32 trillion, at the end of 2019, reflecting increases in all major categories of assets, particularly in portfolio investment and direct investment assets. Portfolio investment assets increased by $2.02 trillion, to $13.51 trillion, and direct investment assets increased by $1.33 trillion, to $8.84 trillion. These increases were driven mainly by foreign stock price increases that raised the value of these assets.
U.S. liabilities increased by $5.51 trillion, to a total of $40.31 trillion, at the end of 2019, reflecting increases in all major categories of liabilities, particularly in portfolio investment and direct investment liabilities. Portfolio investment liabilities increased by $2.76 trillion, to $21.48 trillion, and direct investment liabilities increased by $2.10 trillion, to $10.58 trillion. These increases were driven mainly by U.S. stock price increases that raised the value of these liabilities.
Upcoming Update to the U.S. International Investment Position
The annual update of the U.S. international investment position will be released along with preliminary estimates for the first quarter of 2020 on June 30, 2020. A preview of the annual update will appear in the April 2020 issue of the Survey of Current Business.
* * *
Next release: June 30, 2020, at 8:30 A.M. EDT
U.S. International Investment Position, First Quarter 2020, Year 2019, and Annual Update
* * *