
Bureau of Economic Analysis
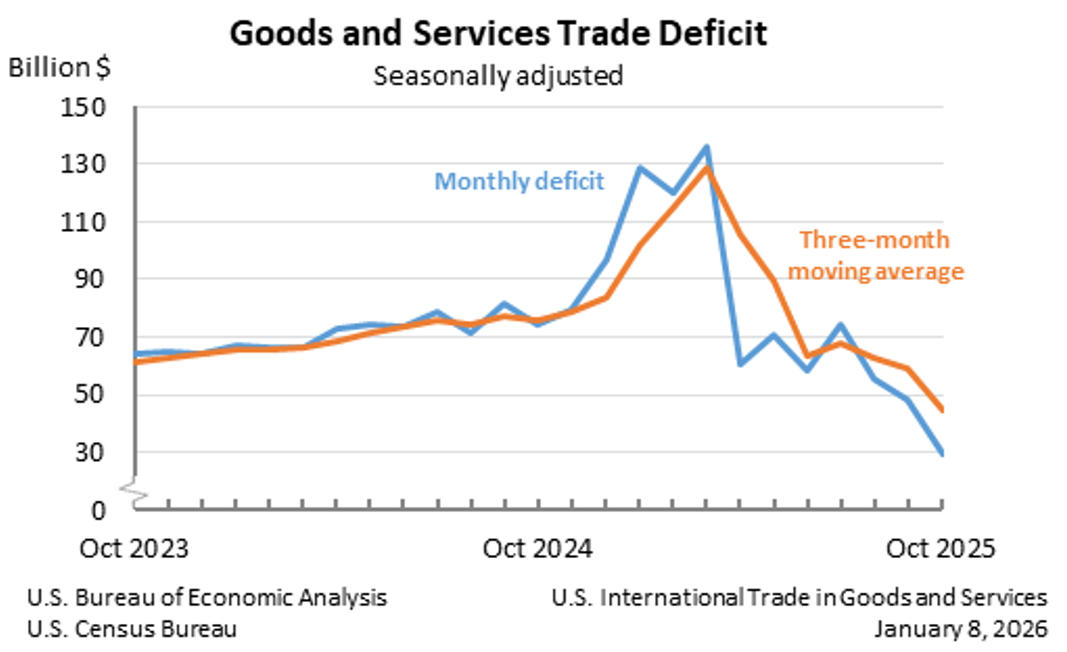
U.S. International Trade in Goods and Services, October 2025
The U.S. goods and services trade deficit decreased in October 2025 according to the U.S. Bureau of Economic Analysis and the U.S. Census Bureau. The deficit decreased from $48.1 billion in September (revised) to $29.4 billion in October, as exports increased and imports decreased. The goods deficit decreased $19.2 billion in October to $59.1 billion. The services surplus decreased $0.4 billion in October to $29.8 billion.
Principal Federal Economic Indicators
Noteworthy


The Latest
We’re More Than GDP: Key International Stats Come From Our Surveys
A blog from BEA Director Vipin Arora
Here is a fact that may surprise you: The Bureau of Economic Analysis conducts 17 surveys. Yes, the home of gross domestic product, personal consumption expenditure prices, and the current account is also in the big leagues when it comes to running surveys. Not just any surveys, but some of the most unique ones around—collecting information that ranges from direct investment and the activities of…
Marine Economy Satellite Account, 2022
The Marine Economy Satellite Account statistics released today by the U.S. Bureau of Economic Analysis show the marine economy accounted for $476.2 billion, or 1.8 percent, of current-dollar U.S. gross domestic product in 2022, an increase from $424.2 billion, or 1.8 percent, in 2021. The marine economy accounted for 1.7 percent, or $776.9 billion, of current-dollar gross output.
Marine Economy Satellite Account, 2022
The Marine Economy Satellite Account statistics released today by the U.S. Bureau of Economic Analysis show the marine economy accounted for $476.2 billion, or 1.8 percent, of current-dollar U.S. gross domestic product (GDP) in 2022, an increase from $424.2 billion, or 1.8 percent, in 2021. The marine economy accounted for 1.7 percent, or $776.9 billion, of current-dollar gross output.
April 2024 Trade Gap is $74.6 Billion
The U.S. goods and services trade deficit increased from $68.6 billion in March (revised) to $74.6 billion in April, as imports increased more than exports. The goods deficit increased $5.9 billion to $99.2 billion, and the services surplus decreased $0.1 billion to $24.7 billion.
U.S. International Trade in Goods and Services, April 2024
The U.S. goods and services trade deficit increased in April 2024 according to the U.S. Bureau of Economic Analysis and the U.S. Census Bureau. The deficit increased from $68.6 billion in March (revised) to $74.6 billion in April, as imports increased more than exports. The goods deficit increased $5.9 billion in April to $99.2 billion. The services surplus decreased $0.1 billion in April to $24.7 billion.
U.S. International Trade in Goods and Services, Annual Revision
The U.S. goods and services trade deficit increased in April 2024 according to the U.S. Bureau of Economic Analysis and the U.S. Census Bureau. The deficit increased from $68.6 billion in March (revised) to $74.6 billion in April, as imports increased more than exports. The goods deficit increased $5.9 billion in April to $99.2 billion. The services surplus decreased $0.1 billion in April to $24.7 billion.
Coming Soon: More International Investment Position Data, Quarterly Detail on Prices, Exchange Rates
BEA will begin publishing on June 26 new quarterly detail for the U.S. international investment position (IIP), a statistical balance sheet that presents the dollar value of U.S. financial assets and liabilities with respect to other countries at the end of each quarter and year. The IIP statistics are published in BEA news releases and interactive data tables in March, June, September, and December.
Personal Income and Outlays, April 2024
Personal income increased $65.3 billion (0.3 percent at a monthly rate) in April. Disposable personal income —personal income less personal current taxes—increased $40.2 billion (0.2 percent). Personal outlays—the sum of personal consumption expenditures, personal interest payments, and personal current transfer payments—increased $42.8 billion (0.2 percent) and consumer spending increased $39.1 billion (0.2 percent). Personal saving was $744…
Personal Income and Outlays, April 2024
Personal income increased $65.3 billion (0.3 percent at a monthly rate) in April. Disposable personal income (DPI)—personal income less personal current taxes—increased $40.2 billion (0.2 percent). Personal outlays—the sum of personal consumption expenditures (PCE), personal interest payments, and personal current transfer payments—increased $42.8 billion (0.2 percent) and consumer spending increased $39.1 billion (0.2 percent). Personal saving…
Gross Domestic Product (Second Estimate) Corporate Profits (Preliminary Estimate) First Quarter 2024
Real gross domestic product increased at an annual rate of 1.3 percent in the first quarter of 2024, according to the “second” estimate. In the fourth quarter of 2023, real GDP increased 3.4 percent. The GDP estimate for the first quarter was revised down 0.3 percentage point from the “advance” estimate, primarily reflecting a downward revision to consumer spending.