
Bureau of Economic Analysis
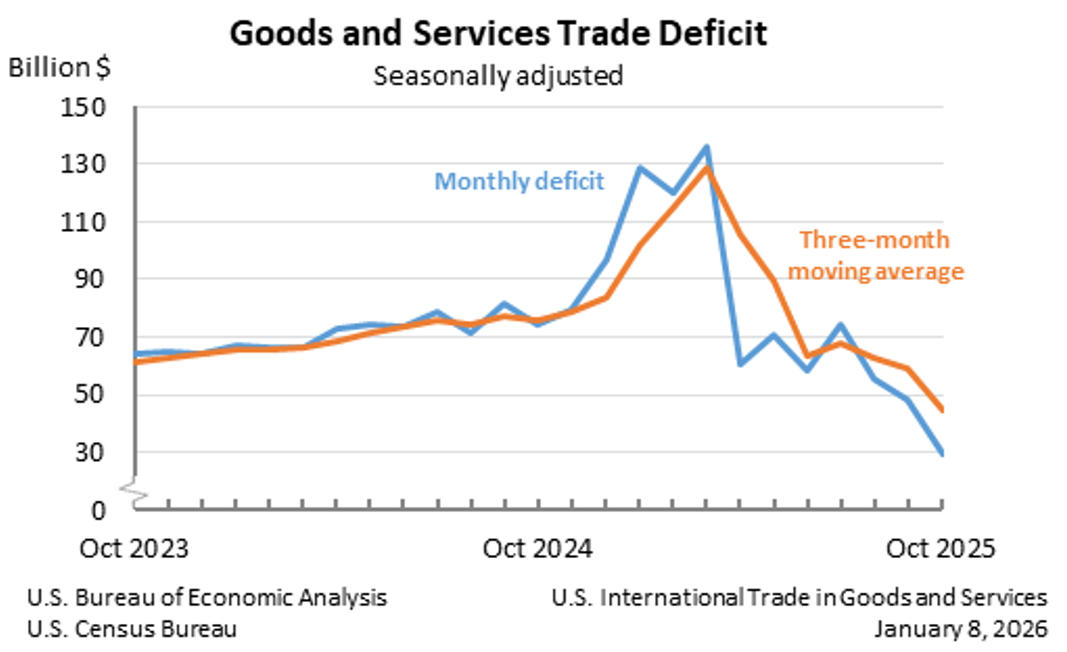
U.S. International Trade in Goods and Services, October 2025
The U.S. goods and services trade deficit decreased in October 2025 according to the U.S. Bureau of Economic Analysis and the U.S. Census Bureau. The deficit decreased from $48.1 billion in September (revised) to $29.4 billion in October, as exports increased and imports decreased. The goods deficit decreased $19.2 billion in October to $59.1 billion. The services surplus decreased $0.4 billion in October to $29.8 billion.
Principal Federal Economic Indicators
Noteworthy


The Latest
Personal Income and Outlays, July 2024
Personal income increased $75.1 billion (0.3 percent at a monthly rate) in July. Disposable personal income (DPI)—personal income less personal current taxes—increased $54.8 billion (0.3 percent). Personal outlays—the sum of personal consumption expenditures (PCE), personal interest payments, and personal current transfer payments—increased $103.3 billion (0.5 percent) and consumer spending increased $103.8 billion (0.5 percent). Personal saving…
Gross Domestic Product (Second Estimate) Corporate Profits (Preliminary Estimate) Second Quarter 2024
Real gross domestic product (GDP) increased at an annual rate of 3.0 percent in the second quarter of 2024, according to the “second” estimate. In the first quarter, real GDP increased 1.4 percent. The GDP estimate for the second quarter was revised up 0.2 percentage point from the “advance” estimate, primarily reflecting an upward revision to consumer spending.
Gross Domestic Product (Second Estimate), Corporate Profits (Preliminary Estimate), Second Quarter 2024
Real gross domestic product (GDP) increased at an annual rate of 3.0 percent in the second quarter of 2024, according to the "second" estimate. In the first quarter, real GDP increased 1.4 percent. The increase in the second quarter primarily reflected increases in consumer spending, private inventory investment, and business investment. Imports, which are a subtraction in the calculation of GDP, increased.
Activities of U.S. Multinational Enterprises, 2022
Worldwide employment by U.S. multinational enterprises increased 2.2 percent to 44.3 million workers in 2022 from 43.3 million workers in 2021 (revised).
Activities of U.S. Multinational Enterprises, 2022
Worldwide employment by U.S. multinational enterprises increased 2.2 percent to 44.3 million workers in 2022 (preliminary) from 43.3 million workers in 2021 (revised), according to statistics released today by the U.S. Bureau of Economic Analysis on the operations and finances of U.S. parent companies and their foreign affiliates.
Rubik’s Cubes and Business Inventories
A blog from BEA Director Vipin Arora
The first time a friend handed me a Rubik’s Cube I thought it would be easy to solve. I was wrong. BEA’s estimates of businesses’ inventories sometimes remind me of that experience. They seem relatively simple at first, but they turn out to be more complicated than expected. The good news is that, just like we can learn to solve a Rubik’s Cube with a few rules of thumb, we can understand BEA’s…
June 2024 Trade Gap is $73.1 Billion
The U.S. goods and services trade deficit decreased from $75.0 billion in May (revised) to $73.1 billion in June, as exports increased more than imports. The goods deficit decreased $2.5 billion to $97.4 billion, and the services surplus decreased $0.6 billion to $24.2 billion.
U.S. International Trade in Goods and Services, June 2024
The U.S. goods and services trade deficit decreased in June 2024 according to the U.S. Bureau of Economic Analysis and the U.S. Census Bureau. The deficit decreased from $75.0 billion in May (revised) to $73.1 billion in June, as exports increased more than imports. The goods deficit decreased $2.5 billion in June to $97.4 billion. The services surplus decreased $0.6 billion in June to $24.2 billion.
BEA: Taking Economic Statistics Personally Since 1938
A blog from BEA Director Vipin Arora
When I hear the phrase “personal income,” I think about my paycheck. When we talk about personal income in the context of BEA’s economic statistics, however, it’s my paycheck, your paycheck, your cousin’s paycheck—and much more. In fact, I believe our monthly personal income statistics are the most comprehensive measure of U.S. economic activity available on a monthly basis. They are also a widely…
Producto interior bruto para Puerto Rico, 2022
El producto interior bruto real (PIB) para Puerto Rico decreció 2.5 por ciento en 2022, luego de crecer 4.1 por ciento en 2021, de acuerdo con las estadísticas difundidas hoy por el Negociado de Análisis Económico de EE. UU. (BEA por sus siglas en inglés). El decrecimiento en el PIB real en 2022 reflejó un aumento en las importaciones —que son un elemento de resta en el cálculo del PIB— así como decrecimientos en la inversión privada en…