
Bureau of Economic Analysis
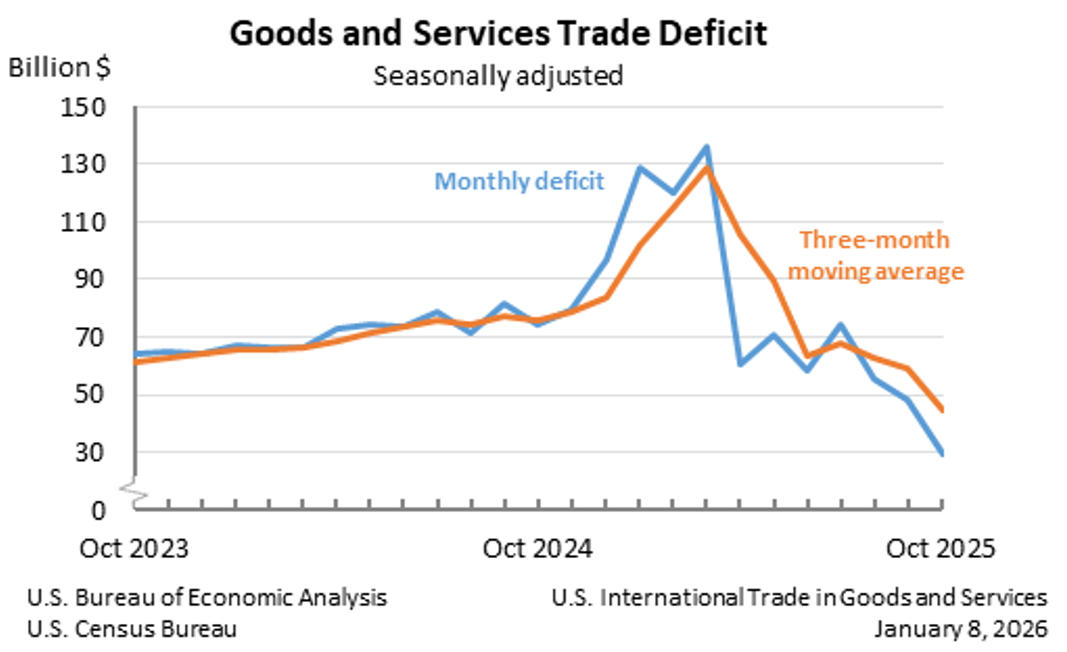
U.S. International Trade in Goods and Services, October 2025
The U.S. goods and services trade deficit decreased in October 2025 according to the U.S. Bureau of Economic Analysis and the U.S. Census Bureau. The deficit decreased from $48.1 billion in September (revised) to $29.4 billion in October, as exports increased and imports decreased. The goods deficit decreased $19.2 billion in October to $59.1 billion. The services surplus decreased $0.4 billion in October to $29.8 billion.
Principal Federal Economic Indicators
Noteworthy


The Latest
Gross Domestic Product (Second Estimate) Corporate Profits (Preliminary Estimate) Third Quarter 2024
Real gross domestic product (GDP) increased at an annual rate of 2.8 percent in the third quarter of 2024, according to the “second” estimate. In the second quarter, real GDP increased 3.0 percent. The increase in the third quarter primarily reflected increases in consumer spending, exports, federal government spending, and business investment. Imports, which are a subtraction in the calculation of GDP, increased.
Gross Domestic Product, Third Quarter 2024 (Second Estimate) and Corporate Profits (Preliminary)
Real gross domestic product (GDP) increased at an annual rate of 2.8 percent in the third quarter of 2024, according to the “second” estimate. In the second quarter, real GDP increased 3.0 percent. The increase in the third quarter primarily reflected increases in consumer spending, exports, federal government spending, and business investment. Imports, which are a subtraction in the calculation of GDP, increased.
Gross Domestic Product for the Commonwealth of the Northern Mariana Islands, 2021 and 2022
Real gross domestic product (GDP) for the Commonwealth of the Northern Mariana Islands increased 16.7 percent in 2022 and 5.1 percent in 2021 after decreasing 29.1 percent in 2020. The growth in real GDP from 2021 to 2022 reflected increases in exports, government spending, and private fixed investment. These increases were partly offset by a decrease in personal consumption expenditures. Imports, a subtraction item in the calculation of GDP,…
Outdoor Recreation Satellite Account, U.S. and States, 2023
The value added of the outdoor recreation economy accounted for 2.3 percent ($639.5 billion) of current-dollar gross domestic product (GDP) for the nation in 2023. At the state level, value added for outdoor recreation as a share of state GDP ranged from 6.3 percent in Hawaii to 1.6 percent in Delaware, Connecticut, and New York. The share was 0.8 percent in the District of Columbia.
Activities of U.S Affiliates of Foreign Multinational Enterprises, 2022
Majority-owned U.S. affiliates of foreign multinational enterprises employed 8.35 million workers in the United States in 2022, a 6.8 percent increase from 7.82 million workers in 2021, according to the U.S. Bureau of Economic Analysis. These affiliates accounted for 6.2 percent of total private-industry employment in the United States in 2022.
Activities of U.S. Affiliates of Foreign Multinational Enterprises, 2022
Majority-owned U.S. affiliates of foreign multinational enterprises employed 8.35 million workers in the United States in 2022, a 6.8 percent increase from 7.82 million workers in 2021, according to the U.S. Bureau of Economic Analysis. These affiliates accounted for 6.2 percent of total private-industry employment in the United States in 2022.
Personal Income by County and Metropolitan Area, 2023
In 2023, personal income, in current dollars, increased in 2,814 counties, decreased in 295, and was unchanged in five counties in 2023. Personal income increased 6.0 percent in the metropolitan portion of the United States and 4.7 percent in the nonmetropolitan portion.
September 2024 Trade Gap is $84.4 Billion
The U.S. goods and services trade deficit increased from $70.8 billion in August (revised) to $84.4 billion in September, as exports decreased and imports increased. The goods deficit increased $14.2 billion to $109.0 billion, and the services surplus increased $0.6 billion to $24.6 billion.
U.S. International Trade in Goods and Services, September 2024
The U.S. monthly international trade deficit increased in September 2024 according to the U.S. Bureau of Economic Analysis and the U.S. Census Bureau. The deficit increased from $70.8 billion in August (revised) to $84.4 billion in September, as exports decreased and imports increased. The goods deficit increased $14.2 billion in September to $109.0 billion. The services surplus increased $0.6 billion in September to $24.6 billion.
Personal Income and Outlays, September 2024
Personal income increased $71.6 billion (0.3 percent at a monthly rate) in September. Disposable personal income (DPI)—personal income less personal current taxes—increased $57.4 billion (0.3 percent). Personal outlays—the sum of personal consumption expenditures, personal interest payments, and personal current transfer payments—increased $106.3 billion (0.5 percent) and consumer spending increased $105.8 billion (0.5 percent). Personal…