
Bureau of Economic Analysis
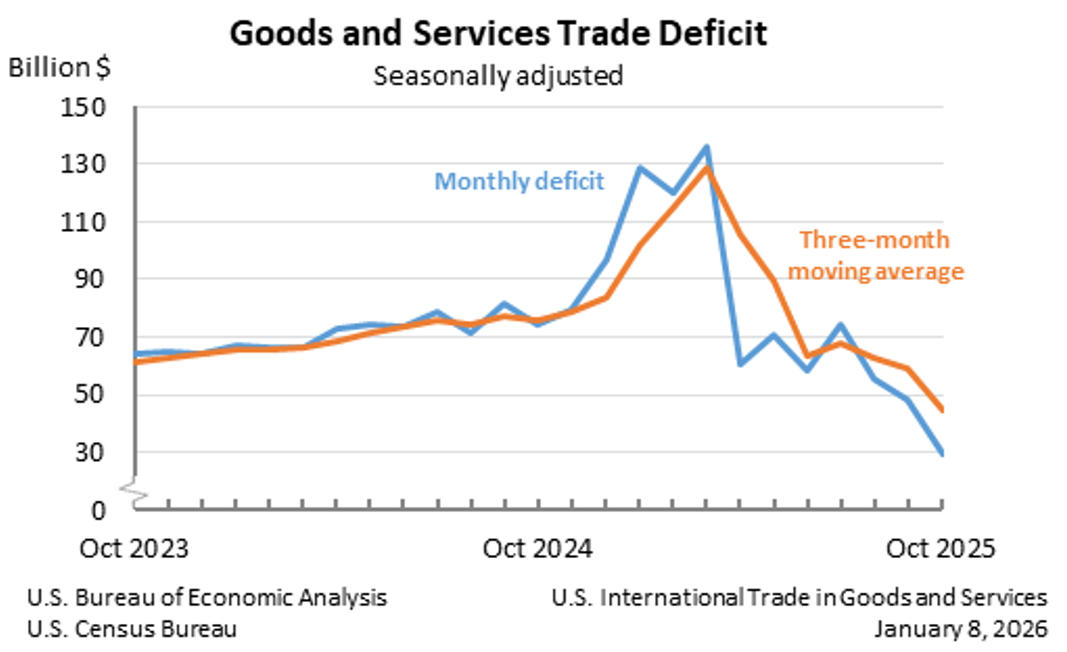
U.S. International Trade in Goods and Services, October 2025
The U.S. goods and services trade deficit decreased in October 2025 according to the U.S. Bureau of Economic Analysis and the U.S. Census Bureau. The deficit decreased from $48.1 billion in September (revised) to $29.4 billion in October, as exports increased and imports decreased. The goods deficit decreased $19.2 billion in October to $59.1 billion. The services surplus decreased $0.4 billion in October to $29.8 billion.
Principal Federal Economic Indicators
Noteworthy


The Latest
Personal Income and Outlays, September 2024
Personal income increased $71.6 billion (0.3 percent at a monthly rate) in September. Disposable personal income (DPI)—personal income less personal current taxes—increased $57.4 billion (0.3 percent). Personal outlays—the sum of personal consumption expenditures (PCE), personal interest payments, and personal current transfer payments—increased $106.3 billion (0.5 percent) and consumer spending increased $105.8 billion (0.5 percent). Personal…
Gross Domestic Product, Third Quarter 2024 (Advance)
Real gross domestic product (GDP) increased at an annual rate of 2.8 percent in the third quarter of 2024, according to the “advance” estimate. In the second quarter, real GDP increased 3.0 percent. The increase in the third quarter primarily reflected increases in consumer spending, exports, and federal government spending. Imports, which are a subtraction in the calculation of GDP, increased.
Gross Domestic Product, Third Quarter 2024 (Advance Estimate)
Real gross domestic product (GDP) increased at an annual rate of 2.8 percent in the third quarter of 2024, according to the "advance" estimate. In the second quarter, real GDP increased 3.0 percent. The increase in the third quarter primarily reflected increases in consumer spending, exports, and federal government spending. Imports, which are a subtraction in the calculation of GDP, increased.
August 2024 Trade Gap is $70.4 Billion
The U.S. goods and services trade deficit decreased from $78.9 billion in July (revised) to $70.4 billion in August, as exports increased and imports decreased. The goods deficit decreased $8.4 billion to $94.9 billion, and the services surplus increased $0.1 billion to $24.4 billion.
U.S. International Trade in Goods and Services, August 2024
The U.S. monthly international trade deficit decreased in August 2024 according to the U.S. Bureau of Economic Analysis and the U.S. Census Bureau. The deficit decreased from $78.9 billion in July (revised) to $70.4 billion in August, as exports increased and imports decreased. The goods deficit decreased $8.4 billion in August to $94.9 billion. The services surplus increased $0.1 billion in August to $24.4 billion.
Personal Consumption Expenditures by State, 2023
Personal consumption expenditures (PCE) increased in all 50 states and the District of Columbia in 2023. The percent change ranged from 8.1 percent in Florida to 4.7 percent in Iowa. Nationally, current-dollar PCE increased 6.4 percent in 2023 after increasing 9.8 percent in 2022.
Gross Domestic Product by State and Personal Income by State, 2nd Quarter 2024
Real gross domestic product increased in 49 states and the District of Columbia in the second quarter of 2024, with the percent change ranging from 5.9 percent at an annual rate in Idaho to –1.1 percent in Alaska.
Personal Income and Outlays, August 2024
Personal income increased $50.5 billion (0.2 percent at a monthly rate) in August. Disposable personal income —personal income less personal current taxes— increased $34.2 billion (0.2 percent). Personal outlays—the sum of personal consumption expenditures, personal interest payments, and personal current transfer payments—increased $48.3 billion (0.2 percent) and consumer spending increased $47.2 billion (0.2 percent). Personal saving was $1…
Personal Income and Outlays, August 2024
Personal income increased $50.5 billion (0.2 percent at a monthly rate) in August. Disposable personal income (DPI)—personal income less personal current taxes— increased $34.2 billion (0.2 percent). Personal outlays—the sum of personal consumption expenditures (PCE), personal interest payments, and personal current transfer payments—increased $48.3 billion (0.2 percent) and consumer spending increased $47.2 billion (0.2 percent). Personal…
Gross Domestic Product (Third Estimate), Corporate Profits (Revised Estimate), and GDP by Industry, Second Quarter 2024 and Annual Update
Real gross domestic product (GDP) increased at an annual rate of 3.0 percent in the second quarter of 2024, according to the “third” estimate. In the first quarter, real GDP increased 1.6 percent (revised). The second-quarter increase in real GDP was the same as previously estimated in the “second” estimate released in August.