
Bureau of Economic Analysis
U.S. International Trade in Goods and Services, October 2025
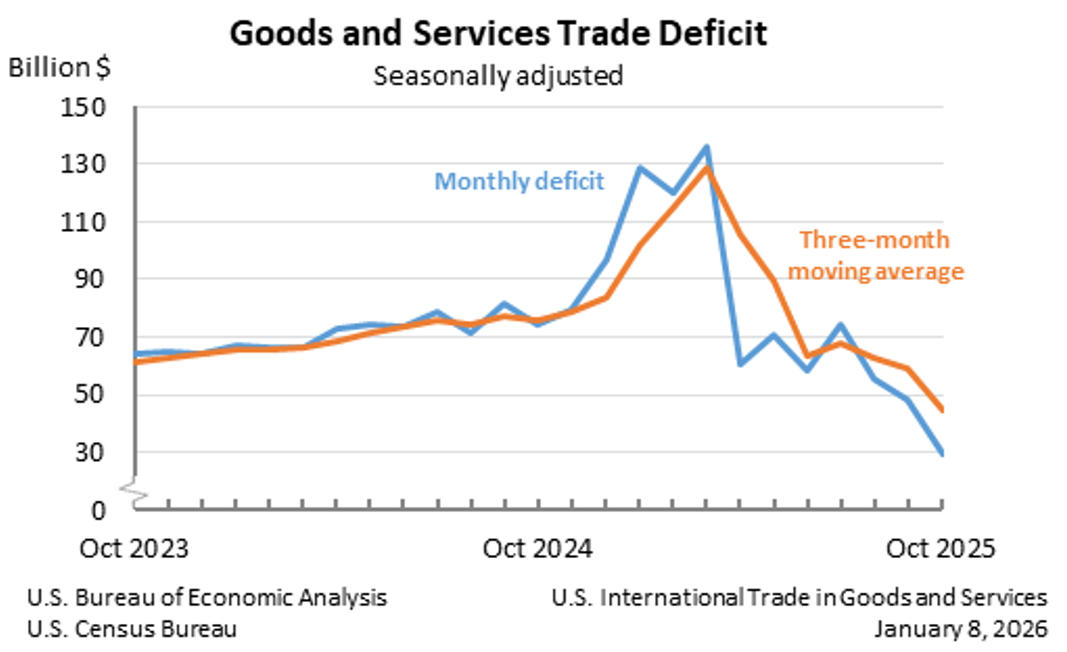
The U.S. goods and services trade deficit decreased in October 2025 according to the U.S. Bureau of Economic Analysis and the U.S. Census Bureau. The deficit decreased from $48.1 billion in September (revised) to $29.4 billion in October, as exports increased and imports decreased. The goods deficit decreased $19.2 billion in October to $59.1 billion. The services surplus decreased $0.4 billion in October to $29.8 billion.
Principal Federal Economic Indicators
Noteworthy


The Latest
U.S. International Trade in Goods and Services, October 2021
The U.S. monthly international trade deficit decreased in October 2021 according to the U.S. Bureau of Economic Analysis and the U.S. Census Bureau. The deficit decreased from $81.4 billion in September (revised) to $67.1 billion in October, as exports increased more than imports. The previously published September deficit was $80.9 billion. The goods deficit decreased $14.0 billion in October to $83.9 billion. The services surplus increased $0.…
Gross Domestic Product for Guam, 2020
Real gross domestic product (GDP) for Guam decreased 11.9 percent in 2020 after increasing 2.5 percent in 2019, according to statistics released today by the U.S. Bureau of Economic Analysis. These statistics were developed under the Statistical Improvement Program funded by the Office of Insular Affairs of the U.S. Department of the Interior.
Gross Domestic Product for Guam, 2020
Real gross domestic product (GDP) for Guam decreased 11.9 percent in 2020 after increasing 2.5 percent in 2019, according to statistics released today by the U.S. Bureau of Economic Analysis. The decrease in real GDP reflected decreases in exports of goods and services and personal consumption expenditures. These decreases were partly offset by increases in federal government spending, territorial government spending, and private fixed…
Gross Domestic Product for American Samoa, 2020
Real gross domestic product for American Samoa increased 4.0 percent in 2020 after decreasing 0.6 percent in 2019, according to statistics released today by the U.S. Bureau of Economic Analysis . These statistics were developed under the Statistical Improvement Program funded by the Office of Insular Affairs of the U.S. Department of the Interior.
Gross Domestic Product for American Samoa, 2020
Real gross domestic product (GDP) for American Samoa increased 4.0 percent in 2020 after decreasing 0.6 percent in 2019. The increase in real GDP reflected widespread growth among the major components of GDP including exports, private inventory investment, and government spending. These increases were partly offset by an increase in imports, which is a subtraction item in the calculation of GDP.
Personal Income and Outlays, October 2021
Personal income increased $93.4 billion, or 0.5 percent at a monthly rate, while consumer spending increased$214.3 billion, or 1.3 percent, in October. The increase in personal income primarily reflected an increase in compensation of employees. The personal saving rate (that is, personal saving as a percentage of disposable personal income) was 7.3 percent in October, compared with 8.2 percent in September.
Personal Income and Outlays, October 2021
Personal income increased $93.4 billion, or 0.5 percent at a monthly rate, while consumer spending increased $214.3 billion, or 1.3 percent, in October. The increase in personal income primarily reflected an increase in compensation of employees. The personal saving rate (that is, personal saving as a percentage of disposable personal income) was 7.3 percent in October, compared with 8.2 percent in September.
Gross Domestic Product, Third Quarter 2021 (Second Estimate); Corporate Profits, Third Quarter 2021 (Preliminary Estimate)
Real gross domestic product (GDP) increased at an annual rate of 2.1 percent in the third quarter of 2021, following an increase of 6.7 percent in the second quarter. The increase was revised up 0.1 percentage point from the “advance” estimate released in October. The deceleration in real GDP in the third quarter was led by a slowdown in consumer spending. A resurgence of COVID-19 cases resulted in new restrictions and delays in the reopening of…
Gross Domestic Product (Second Estimate) Corporate Profits (Preliminary Estimate) Third Quarter 2021
Real gross domestic product (GDP) increased at an annual rate of 2.1 percent in the third quarter of 2021, following an increase of 6.7 percent in the second quarter. The increase was revised up 0.1 percentage point from the “advance” estimate released in October. The deceleration in real GDP in the third quarter was led by a slowdown in consumer spending. A resurgence of COVID-19 cases resulted in new restrictions and delays in the reopening…
Personal Income by County and Metropolitan Area, 2020
In 2020, personal income increased in 3,040 counties, decreased in 69, and was unchanged in 3. Personal income increased 6.4 percent in the metropolitan portion of the United States and increased 7.6 percent in the nonmetropolitan portion. Personal income estimates were impacted by the response to the spread of COVID-19, as governments issued and lifted “stay-at-home” orders. The full economic effects of the COVID-19 pandemic cannot be…