
News Release
U.S. International Transactions, Fourth Quarter and Year 2019
Current Account Deficit Narrows by 12.4 Percent in Fourth Quarter
Current Account Balance, Fourth Quarter
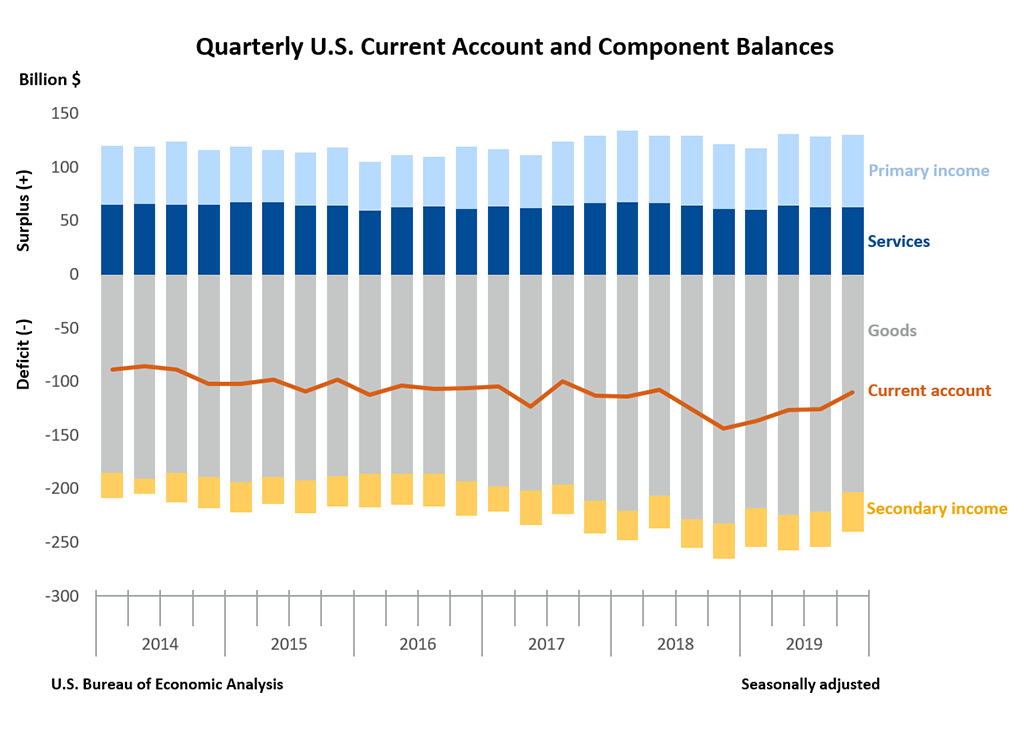
The U.S. current account deficit, which reflects the combined balances on trade in goods and services and income flows between U.S. residents and residents of other countries, narrowed by $15.6 billion, or 12.4 percent, to $109.8 billion in the fourth quarter of 2019, according to statistics from the U.S. Bureau of Economic Analysis (BEA). The revised third quarter deficit was $125.4 billion.
The fourth quarter deficit was 2.0 percent of current dollar gross domestic product (GDP), down from 2.3 percent in the third quarter.
The $15.6 billion narrowing of the current account deficit in the fourth quarter mainly reflected a reduced deficit on goods that was partly offset by an expanded deficit on secondary income.
Current Account Transactions (tables 1-5)
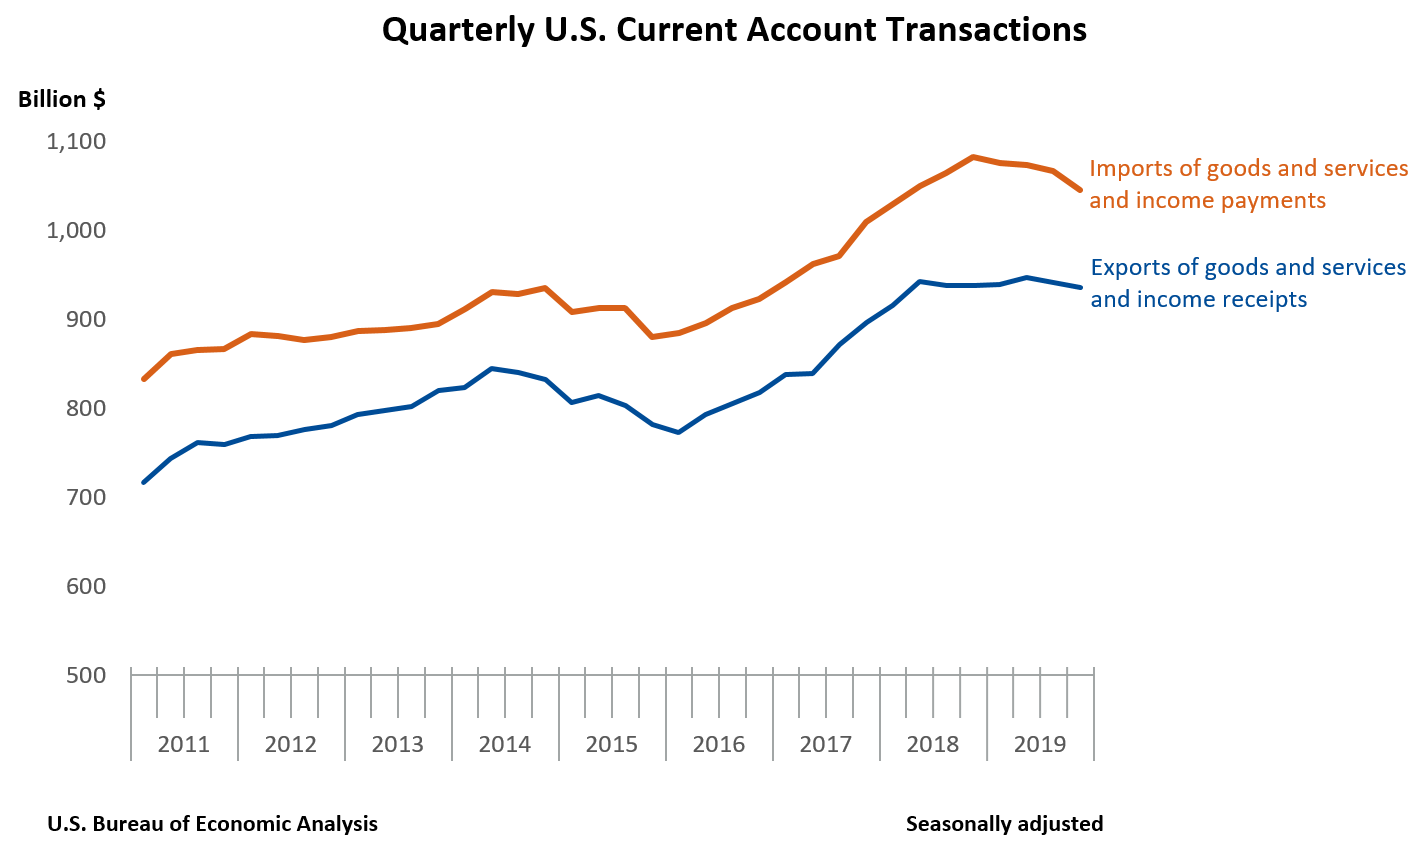
Exports of goods and services to, and income received from, foreign residents decreased $5.1 billion, to $936.1 billion, in the fourth quarter. Imports of goods and services from, and income paid to, foreign residents decreased $20.7 billion, to $1.05 trillion.
Trade in Goods (table 2)
Exports of goods decreased $2.5 billion, to $409.7 billion, led by a decrease in foods, feeds, and beverages, mainly soybeans. Changes in the other major categories were nearly offsetting. Imports of goods decreased $20.6 billion, to $612.5 billion, mainly reflecting decreases in consumer goods, led by apparel, footwear, and household goods, and in automotive, vehicles, parts, and engines, led by trucks, buses, and special purpose vehicles.
Trade in Services (table 3)
Exports of services increased $2.8 billion, to $213.9 billion, mainly reflecting increases in travel, primarily other personal travel, and in other business services, mostly professional and management consulting services. Imports of services increased $2.3 billion, to $151.0 billion, reflecting increases in all major categories. Increases were led by travel, mainly other personal travel.
Primary Income (table 4)
Receipts of primary income decreased $2.8 billion, to $278.0 billion, and payments of primary income decreased $4.2 billion, to $210.7 billion. The decreases in both receipts and payments mainly reflected decreases in other investment income, mostly interest on loans and deposits.
Secondary Income (table 5)
Receipts of secondary income decreased $2.5 billion, to $34.4 billion, mainly reflecting a decrease in private sector fines and penalties, a component of private transfer receipts. Payments of secondary income increased $1.9 billion, to $71.7 billion, mainly reflecting an increase in U.S. government grants.
Financial Account Transactions, Fourth Quarter (tables 1, 6, 7, and 8)
Net financial account transactions were −$71.8 billion in the fourth quarter, reflecting net U.S. borrowing from foreign residents.
Financial Assets (tables 1, 6, 7, and 8)
Fourth quarter transactions increased U.S. residents' foreign financial assets by $1.0 billion. Transactions increased direct investment assets, mainly equity, by $35.2 billion; portfolio investment assets by $18.9 billion, resulting from large and mostly offsetting transactions in equity securities and debt securities; and reserve assets by $0.2 billion. Transactions decreased other investment assets, primarily loans, by $53.4 billion.
Liabilities (tables 1, 6, 7, and 8)
Fourth quarter transactions increased U.S. liabilities to foreign residents by $71.9 billion. Transactions increased direct investment liabilities, mainly equity, by $43.5 billion and other investment liabilities, mainly loans, by $56.5 billion. Transactions decreased portfolio investment liabilities, mainly short-term debt securities, by $28.2 billion.
Financial Derivatives (table 1)
Net transactions in financial derivatives were −$0.9 billion in the fourth quarter, reflecting net borrowing from foreign residents.
|
Updates to Third Quarter 2019 International Transactions Accounts Balances Billions of dollars, seasonally adjusted |
||
| Preliminary estimate | Revised estimate | |
|---|---|---|
| Current account balance | -124.1 | −125.4 |
| Goods balance | −219.6 | −220.9 |
| Services balance | 62.2 | 62.5 |
| Primary income balance | 68.7 | 65.9 |
| Secondary income balance | −35.5 | −32.9 |
| Net financial account transactions | −47.9 | −76.4 |
Current Account Balance, Year 2019
The U.S. current account deficit widened by $7.4 billion, or 1.5 percent, to $498.4 billion in 2019. The deficit was 2.3 percent of current dollar GDP, down from 2.4 percent in 2018.
The $7.4 billion widening of the current account deficit in 2019 mainly reflected an expanded deficit on secondary income and a reduced surplus on services that were partly offset by a reduced deficit on goods.
Current Account Transactions (tables 1-5)
Exports of goods and services to, and income received from, foreign residents increased $28.3 billion, to $3.76 trillion, in 2019. Imports of goods and services from, and income paid to, foreign residents increased $35.6 billion, to $4.26 trillion.
Trade in Goods (table 2)
Exports of goods decreased $21.5 billion, to $1.65 trillion, mainly reflecting a decrease in capital goods, mostly civilian aircraft. Imports of goods decreased $42.6 billion, to $2.52 trillion, mainly reflecting a decrease in industrial supplies and materials, mostly petroleum and products.
Trade in Services (table 3)
Exports of services increased $18.2 billion, to $845.2 billion, mainly reflecting an increase in other business services, primarily professional and management consulting services. Imports of services increased $28.1 billion, to $595.4 billion, reflecting increases in all major categories. Increases were led by travel, mostly other personal travel.
Primary Income (table 4)
Receipts of primary income increased $38.9 billion, to $1.12 trillion, and payments of primary income increased $35.9 billion, to $866.1 billion. The increases in both receipts and payments mainly reflected increases in other investment income, mostly interest on loans, and in portfolio investment income, mostly dividends on equity and investment fund shares.
Secondary Income (table 5)
Receipts of secondary income decreased $7.4 billion, to $142.8 billion, mainly reflecting a decrease in private transfers, mostly insurance-related transfers. Payments of secondary income increased $14.3 billion, to $281.7 billion, mainly reflecting an increase in private transfers, mostly insurance-related transfers.
Financial Account Transactions, Year 2019 (tables 1, 6, 7, and 8)
Net financial account transactions were −$395.9 billion in 2019, reflecting net U.S. borrowing from foreign residents.
Financial Assets (tables 1, 6, 7, and 8)
Transactions in 2019 increased U.S. residents' foreign financial assets by $426.9 billion. Transactions increased direct investment assets, mainly equity, by $197.7 billion; portfolio investment assets, resulting from large and mostly offsetting transactions in equity securities and debt securities, by $35.9 billion; other investment assets, mostly bank deposits, by $188.7 billion; and reserve assets by $4.7 billion.
Liabilities (tables 1, 6, 7, and 8)
Transactions in 2019 increased U.S. liabilities to foreign residents by $784.4 billion. Transactions increased direct investment liabilities, mostly equity, by $310.8 billion; portfolio investment liabilities, resulting from large and partly offsetting transactions in equity securities and debt securities, by $231.6 billion; and other investment liabilities, mostly bank deposits, by $242.0 billion.
Financial Derivatives (table 1)
Net transactions in financial derivatives were −$38.4 billion in 2019, reflecting net borrowing from foreign residents.
Upcoming Update to the U.S. International Transactions Accounts
The annual update of the U.S. international transactions accounts will be released along with preliminary estimates for the first quarter of 2020 on June 19, 2020. A preview of the annual update will appear in the April 2020 issue of the Survey of Current Business.
Change to the European Union
With the release of "U.S. International Transactions, First Quarter 2020 and Annual Update" on June 19, 2020, statistics for the area grouping "European Union" will exclude the United Kingdom, which withdrew from the European Union effective February 1, 2020. For more information, see "What is the impact of the United Kingdom's withdrawal from the European Union on BEA's data products?"
Prototype Tables
With the release of the international transactions accounts (ITAs) on September 19, 2019, BEA introduced two new tables that present: (1) geographic detail by type of transaction (ITA table 1.4) and (2) annual trade in goods and services with expanded country and geographic area detail (ITA table 1.5). These tables were released as prototypes, along with prototypes for the other standard ITA tables that reflect changes that will be introduced with the annual update in June 2020. These prototype tables have been updated to incorporate the statistics from this release. In addition, several of the prototype tables have been modified to include new subcategory detail and other minor changes. For details, see "Prototype Tables for the International Transactions Accounts" (updated March 19, 2020). These prototype tables are provided alongside the current standard presentation to prepare data users for the upcoming changes. With the release of "U.S. International Transactions, First Quarter 2020 and Annual Update" on June 19, 2020, the prototype tables will replace the existing tables as the standard presentation. The prototype tables, published as addenda to the current tables, are available in BEA's interactive data application.
* * *
Next release: June 19, 2020 at 8:30 A.M. EDT
U.S. International Transactions, First Quarter 2020 and Annual Update