
News Release
Activities of U.S. Affiliates of Foreign Multinational Enterprises, 2019
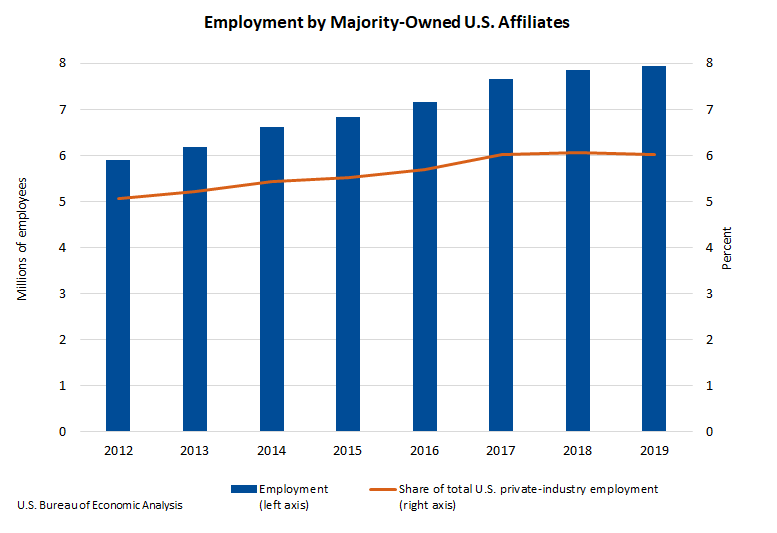
Majority-owned U.S. affiliates (MOUSAs) of foreign multinational enterprises (MNEs) employed 7.95 million workers in the United States in 2019, a 1.1 percent increase from 7.86 million in 2018, according to statistics on MOUSA operations and finances released by the Bureau of Economic Analysis.
MOUSAs accounted for 6.0 percent of total private-industry employment in the United States. Employment by MOUSAs was largest in manufacturing and in retail trade. MOUSAs with ultimate owners in the United Kingdom, Japan, and Canada were the largest contributors to total MOUSA employment. (See the Additional Information for definitions of MOUSAs and other terminology used in this release.)
Current-dollar value added of MOUSAs, a measure of their direct contribution to U.S. gross domestic product (GDP), increased 1.7 percent to $1.1 trillion. MOUSAs accounted for 7.0 percent of total U.S. business-sector value added.
Expenditures for property, plant, and equipment by MOUSAs increased 3.9 percent to $284.6 billion. MOUSAs accounted for 15.7 percent of total U.S. private business capital expenditures. Research and development (R&D) performed by MOUSAs increased 2.5 percent to $71.4 billion. MOUSAs accounted for 15.8 percent of total U.S. business R&D in 2018, the latest year for which all-U.S. business R&D data are available.
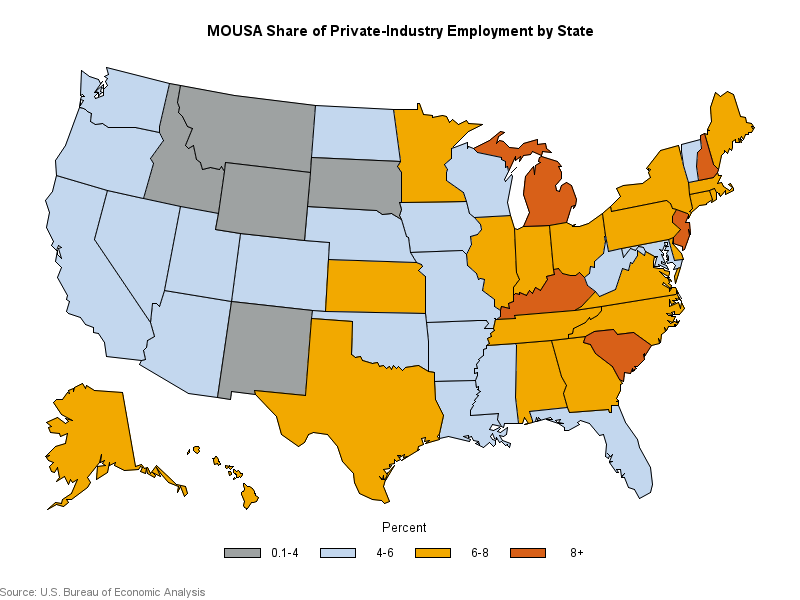
By state, private-industry employment accounted for by MOUSAs was highest in South Carolina (8.9 percent), New Hampshire (8.4 percent), and Kentucky (8.2 percent). In all three states, MOUSAs in the manufacturing industry employed the most workers.
Additional statistics on the activities of U.S. affiliates of foreign multinationals including sales, balance sheet and income statement items, compensation of employees, trade, and more are available on BEA's website. More industry, country, and state level detail are available on the website and will be highlighted in the September issue of the Survey of Current Business.
Updates to the statistics
Statistics for 2018 are revised to incorporate newly available and revised source data. Preliminary statistics for 2018 were released in November 2020 and highlighted in "Activities of U.S. Affiliates of Foreign Multinational Enterprises in 2018" in the December 2020 issue of the Survey of Current Business.
| Preliminary estimate |
Revised estimate |
|
|---|---|---|
| Number of employees (thousands) | 7,808.1 | 7,862.2 |
| Value added | 1,121.2 | 1,114.4 |
| Expenditures for property, plant, and equipment | 277.4 | 273.8 |
| Research and development expenditures | 66.9 | 69.7 |
Next release: August 2022
Activities of U.S. Affiliates of Foreign Multinational Enterprises, 2020