
News Release
U.S. International Transactions, Third Quarter 2021
Current-Account Deficit Widens by 8.3 Percent in Third Quarter
Current-Account Balance
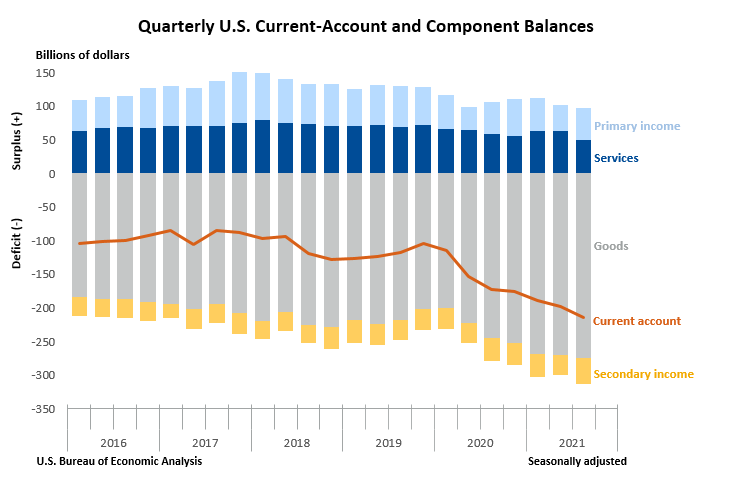
The U.S. current-account deficit, which reflects the combined balances on trade in goods and services and income flows between U.S. residents and residents of other countries, widened by $16.5 billion, or 8.3 percent, to $214.8 billion in the third quarter of 2021, according to statistics released today by the U.S. Bureau of Economic Analysis (BEA). The revised second-quarter deficit was $198.3 billion.
The third-quarter deficit was 3.7 percent of current-dollar gross domestic product, up from 3.5 percent in the second quarter.
The $16.5 billion widening of the current-account deficit in the third quarter reflected a reduced surplus on services and expanded deficits on secondary income and on goods that were partly offset by an expanded surplus on primary income.
Current-Account Transactions (tables 1-5)
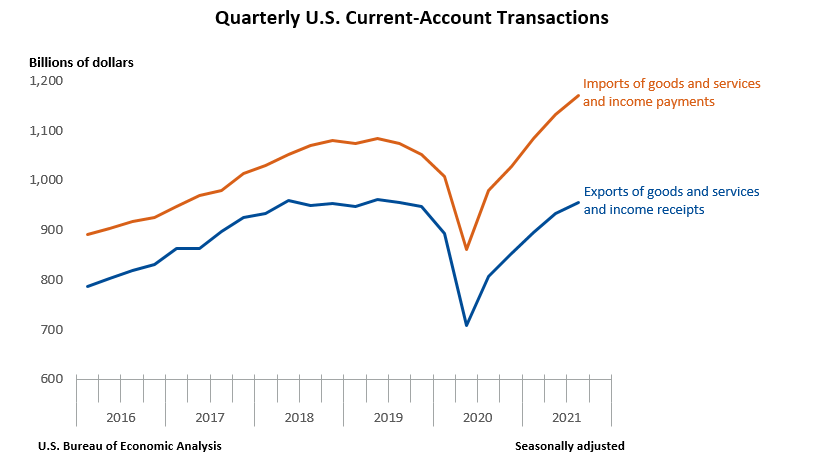
Exports of goods and services to, and income received from, foreign residents increased $22.8 billion to $955.9 billion in the third quarter. Imports of goods and services from, and income paid to, foreign residents increased $39.3 billion to $1.17 trillion.
Trade in goods (table 2)
Exports of goods increased $4.8 billion to $441.6 billion, mainly reflecting increases in industrial supplies and materials, mostly natural gas and petroleum and products, and in consumer goods, mostly medicinal, dental, and pharmaceutical products. A decrease in foods, feeds, and beverages, mostly corn and soybeans, partly offset these increases. Imports of goods increased $10.0 billion to $716.4 billion, primarily reflecting an increase in industrial supplies and materials, mostly petroleum and products and chemicals.
Trade in services (table 3)
Exports of services decreased $0.1 billion to $190.8 billion, primarily reflecting decreases in charges for the use of intellectual property, mostly licenses for the use of outcomes of research and development (such as patents and trade secrets), and in telecommunications, computer, and information services, mostly computer services. An increase in other business services, mostly professional and management consulting services, partly offset these decreases. Imports of services increased $12.6 billion to $141.0 billion, mostly reflecting increases in travel, primarily other personal travel, and in transport, primarily sea freight and air passenger transport.
Primary income (table 4)
Receipts of primary income increased $17.9 billion to $281.9 billion, mainly reflecting increases in direct investment income, primarily earnings, and in portfolio investment income, mostly equity securities. Payments of primary income increased $8.6 billion to $233.7 billion, primarily reflecting an increase in portfolio investment income, mostly interest on long-term debt securities.
Secondary income (table 5)
Receipts of secondary income increased $0.1 billion to $41.6 billion, reflecting an increase in general government transfers, mainly taxes on income and wealth. Payments of secondary income increased $8.0 billion to $79.6 billion, mainly reflecting an increase in general government transfers, mostly international cooperation.
Capital-Account Transactions (table 1)
Capital-transfer receipts were $3.8 billion in the third quarter. The transactions reflected receipts from foreign insurance companies for losses resulting from Hurricane Ida. For information on transactions associated with hurricanes and other disasters, see “How do losses recovered from foreign insurance companies following natural or man-made disasters affect foreign transactions, the current account balance, and net lending or net borrowing?”
Financial-Account Transactions (tables 1, 6, 7, and 8)
Net financial-account transactions were –$127.2 billion in the third quarter, reflecting net U.S. borrowing from foreign residents.
Financial assets (tables 1, 6, 7, and 8)
Third-quarter transactions increased U.S. residents’ foreign financial assets by $494.1 billion. Transactions increased portfolio investment assets, mainly debt securities, by $311.7 billion; reserve assets, primarily special drawing rights (SDRs), by $112.6 billion; and direct investment assets, mostly equity, by $98.2 billion. Transactions decreased other investment assets, mostly deposits, by $28.5 billion. The increase in SDRs reflects the U.S. share of the $650 billion SDR allocation approved by the Board of Governors of the International Monetary Fund (IMF). The SDR is an international reserve asset created by the IMF to supplement its member countries’ official reserves; it can be exchanged between members for currencies, such as the U.S. dollar, the euro, or the yen. The allocation in the third quarter was the largest in the history of the IMF.
Liabilities (tables 1, 6, 7, and 8)
Third-quarter transactions increased U.S. liabilities to foreign residents by $613.3 billion. Transactions increased other investment liabilities, mostly deposits and SDR allocations, by $318.0 billion; direct investment liabilities, mostly equity, by $149.1 billion; and portfolio investment liabilities, primarily equity, by $146.2 billion. The SDR allocation liability represents the long-term obligation of each IMF member country holding SDRs to all other members. In an SDR allocation, the incurrence of U.S. liabilities offsets the acquisition of U.S. assets so the SDR allocation has no impact on the net financial-account transactions.
Financial derivatives (table 1)
Net transactions in financial derivatives were −$8.0 billion in the third quarter, reflecting net U.S. borrowing from foreign residents.
|
Updates to Second-Quarter 2021 International Transactions Accounts Balances Billions of dollars, seasonally adjusted |
||
| Preliminary estimate | Revised estimate | |
|---|---|---|
| Current-account balance | −190.3 | −198.3 |
| Goods balance | −269.7 | −269.6 |
| Services balance | 61.2 | 62.6 |
| Primary income balance | 49.1 | 38.8 |
| Secondary income balance | −31.0 | −30.1 |
| Net financial-account transactions | −287.3 | −216.8 |
Releases of New Statistics on U.S. Resident Special Purpose Entities
With this release of the U.S. International Transactions Accounts (ITAs), BEA is introducing two new ITA tables—tables 4.6 and 6.3—that feature annual statistics on U.S. special purpose entities (SPEs), which are U.S. legal entities with little or no employment or physical presence. The increased prevalence of SPEs heightens the need for separate statistics on their activities for analysis and for improved interpretability of macroeconomic statistics. The new tables fulfill a commitment to the IMF Task Force on Special Purpose Entities to release statistics on SPEs by yearend 2021. ITA table 4.6 presents primary income on foreign direct investment in U.S. resident SPEs, and ITA table 6.3 presents financial transactions for direct investment in U.S. resident SPEs. For more information, see “New Statistics on U.S. Resident Special Purpose Entities in the International Transactions Accounts.”
* * *
Next release: March 24, 2022, at 8:30 A.M. EDT
U.S. International Transactions, Fourth Quarter and Year 2021
* * *
| U.S. International Transactions Release Dates in 2022 | |
|---|---|
| Fourth Quarter and Year 2021 | March 24 |
| First Quarter 2022 and Annual Update | June 23 |
| Second Quarter 2022 | September 22 |
| Third Quarter 2022 | December 21 |