
News Release
U.S. International Transactions, Fourth Quarter and Year 2021
Current-Account Deficit Narrows by 0.9 Percent in Fourth Quarter
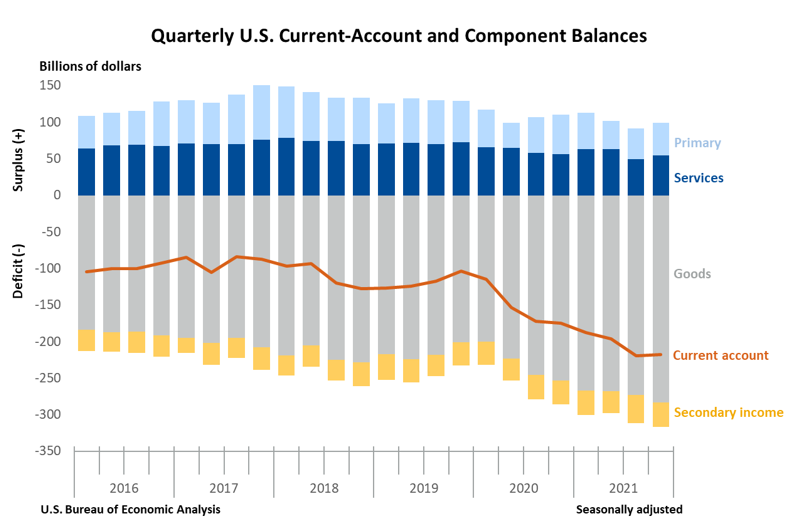
Current-Account Balance, Fourth Quarter
The U.S. current-account deficit, which reflects the combined balances on trade in goods and services and income flows between U.S. residents and residents of other countries, narrowed by $2.0 billion, or 0.9 percent, to $217.9 billion in the fourth quarter of 2021, according to statistics released by the U.S. Bureau of Economic Analysis (BEA). The revised third-quarter deficit was $219.9 billion.
The fourth-quarter deficit was 3.6 percent of current-dollar gross domestic product (GDP), down from 3.8 percent in the third quarter.
The $2.0 billion narrowing of the current-account deficit in the fourth quarter reflected a reduced deficit on secondary income and expanded surpluses on services and on primary income that were mostly offset by an expanded deficit on goods.
Current-Account Transactions (tables 1-5)
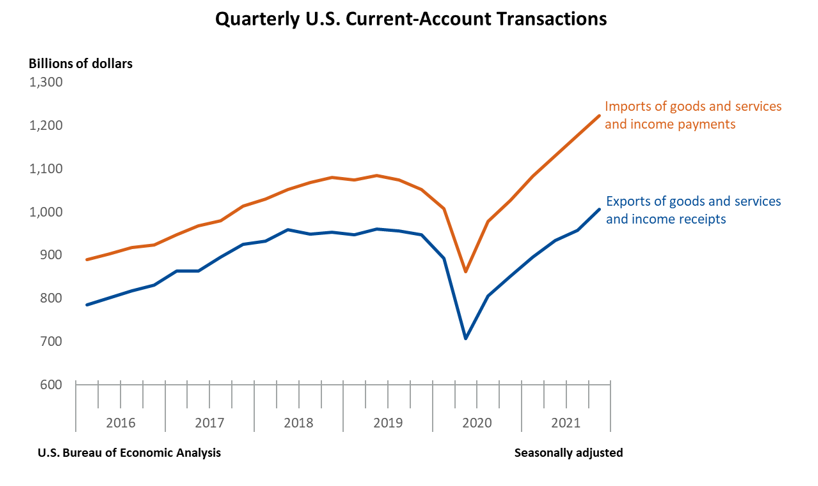
Exports of goods and services to, and income received from, foreign residents increased $47.7 billion to $1.01 trillion in the fourth quarter. Imports of goods and services from, and income paid to, foreign residents increased $45.8 billion to $1.22 trillion.
Trade in goods (table 2)
Exports of goods increased $31.6 billion to $473.5 billion, and imports of goods increased $41.8 billion to $756.9 billion. The increases in both exports and imports reflected increases in all major categories, led by industrial supplies and materials and consumer goods.
Trade in services (table 3)
Exports of services increased $10.7 billion to $204.7 billion, mostly reflecting increases in travel, primarily other personal travel, in transport, primarily air passenger transport, and in charges for the use of intellectual property, primarily licenses for the use of outcomes of research and development (such as patents and trade secrets). Imports of services increased $6.0 billion to $150.2 billion, mostly reflecting increases in transport, primarily sea freight transport, and in travel, primarily other personal travel.
Primary income (table 4)
Receipts of primary income increased $4.5 billion to $284.2 billion, mainly reflecting an increase in portfolio investment income, mostly equity securities. Payments of primary income increased $2.2 billion to $240.0 billion, reflecting an increase in portfolio investment income, mostly interest on long-term debt securities, that was partly offset by a decrease in direct investment income, mainly earnings.
Secondary income (table 5)
Receipts of secondary income increased $1.0 billion to $43.5 billion, mostly reflecting an increase in general government transfers, primarily fines and penalties and taxes on income and wealth. Payments of secondary income decreased $4.3 billion to $76.7 billion, mainly reflecting a decrease in general government transfers, primarily international cooperation.
Capital-Account Transactions (table 1)
Capital-transfer receipts decreased $3.8 billion to $7 million in the fourth quarter. The third-quarter transactions reflected receipts from foreign insurance companies for losses resulting from Hurricane Ida. Capital-transfer payments increased $1.0 billion to $1.9 billion in the fourth quarter, reflecting an increase in U.S. government investment grants.
Financial-Account Transactions (tables 1, 6, 7, and 8)
Net financial-account transactions were −$133.6 billion in the fourth quarter, reflecting net U.S. borrowing from foreign residents.
Financial assets (tables 1, 6, 7, and 8)
Fourth-quarter transactions increased U.S. residents’ foreign financial assets by $113.6 billion. Transactions increased direct investment assets, primarily equity, by $141.0 billion; other investment assets, mostly deposits, by $60.6 billion; and reserve assets by $3.0 billion. Transactions decreased portfolio investment assets by $90.9 billion, resulting from large and partly offsetting transactions in equity and debt securities.
Liabilities (tables 1, 6, 7, and 8)
Fourth-quarter transactions increased U.S. liabilities to foreign residents by $224.4 billion. Transactions increased other investment liabilities, mainly loans, by $170.5 billion, and direct investment liabilities, mostly equity, by $120.2 billion. Transactions decreased portfolio investment liabilities by $66.4 billion, resulting from large and partly offsetting transactions in equity and debt securities.
Financial derivatives (table 1)
Net transactions in financial derivatives were −$22.9 billion in the fourth quarter, reflecting net U.S. borrowing from foreign residents.
|
Updates to Third-Quarter 2021 International Transactions Accounts Balances Billions of dollars, seasonally adjusted |
||
| Preliminary estimate | Revised estimate | |
|---|---|---|
| Current-account balance | −214.8 | −219.9 |
| Goods balance | −274.8 | −273.2 |
| Services balance | 49.9 | 49.8 |
| Primary income balance | 48.2 | 41.9 |
| Secondary income balance | −38.0 | −38.4 |
| Net financial-account transactions | −127.2 | −171.5 |
In addition, seasonally adjusted statistics for all quarters of 2021 were revised so that the totals of the seasonally adjusted quarters equal the annual totals.
Current-Account Balance, Year 2021
The U.S. current-account deficit widened by $205.5 billion, or 33.4 percent, to $821.6 billion in 2021. The deficit was 3.6 percent of current-dollar GDP, up from 2.9 percent in 2020. The $205.5 billion widening of the current-account deficit in 2021 primarily reflected an expanded deficit on goods.
Current-Account Transactions (tables 1-5)
Exports of goods and services to, and income received from, foreign residents increased $535.1 billion to $3.79 trillion in 2021. Imports of goods and services from, and income paid to, foreign residents increased $740.6 billion to $4.62 trillion.
Trade in goods (table 2)
Exports of goods increased $332.9 billion to $1.76 trillion, and imports of goods increased $502.3 billion to $2.85 trillion. The increases in both exports and imports reflected increases in all major categories, led by industrial supplies and materials, mainly petroleum and products.
Trade in services (table 3)
Exports of services increased $65.6 billion to $771.2 billion, mainly reflecting increases in other business services, mostly professional and management consulting services, in financial services, mostly financial management services and credit card and other credit-related services, and in charges for the use of intellectual property, mostly licenses for the use of outcomes of research and development. Imports of services increased $80.9 billion to $541.2 billion, mainly reflecting increases in transport, mostly sea freight transport, and in travel, mostly other personal travel.
Primary income (table 4)
Receipts of primary income increased $132.9 billion to $1.09 trillion, and payments of primary income increased $146.5 billion to $915.9 billion. The increases in both receipts and payments mostly reflected an increase in direct investment income, primarily earnings.
Secondary income (table 5)
Receipts of secondary income increased $3.6 billion to $170.0 billion, reflecting an increase in general government transfers, mostly taxes on income. Payments of secondary income increased $10.9 billion to $305.1 billion, reflecting increases in general government transfers, primarily international cooperation, and in private transfers, led by insurance-related transfers.
Financial-Account Transactions, Year 2021 (tables 1, 6, 7, and 8)
Net financial-account transactions were −$687.1 billion in 2021, reflecting net U.S. borrowing from foreign residents.
Financial assets (tables 1, 6, 7, and 8)
Transactions in 2021 increased U.S. residents’ foreign financial assets by $1.21 trillion. Transactions increased portfolio investment assets, mostly long-term debt securities, by $604.1 billion; direct investment assets, mostly equity, by $501.3 billion; and reserve assets, primarily special drawing rights (SDRs), by $114.0 billion. Transactions decreased other investment assets by $6.1 billion, resulting from large and mostly offsetting transactions in deposits and loans. The increase in SDRs reflects the U.S. share of the $650 billion SDR allocation that was approved by the Board of Governors of the International Monetary Fund (IMF) in the third quarter. The SDR is an international reserve asset created by the IMF to supplement its member countries’ official reserves; it can be exchanged between members for currencies, such as the U.S. dollar, the euro, or the yen.
Liabilities (tables 1, 6, 7, and 8)
Transactions in 2021 increased U.S. liabilities to foreign residents by $1.86 trillion. Transactions increased other investment liabilities, mostly loans and deposits, by $825.9 billion; portfolio investment liabilities, mainly long-term debt securities, by $583.2 billion; and direct investment liabilities, mostly equity, by $449.6 billion.
Financial derivatives (table 1)
Net transactions in financial derivatives were −$41.7 billion in 2021, reflecting net U.S. borrowing from foreign residents.
Upcoming Update to the U.S. International Transactions Accounts
The annual update of the U.S. International Transactions Accounts (ITAs), along with preliminary estimates for the first quarter of 2022, will be released on June 23, 2022. With this annual update, BEA will introduce several new standard ITA tables as well as modify several existing standard table presentations. To prepare data users for these changes, BEA has provided prototype tables, described below, with this release in BEA’s Interactive Data Application. More information will be available in a preview article of BEA’s annual update of the International Economic Accounts in the April 2022 Survey of Current Business.
Prototype Tables
Special purpose entities
With the release of the ITAs on December 21, 2021, BEA introduced two new ITA tables—tables 4.6 and 6.3—that feature statistics on U.S. special purpose entities (SPEs), which are legal entities with little or no employment or physical presence. With the annual update, BEA will expand the scope of these tables to include foreign SPEs. Table 4.6 will present primary income on direct investment in foreign and U.S. SPEs, and table 6.3 will present financial transactions for direct investment in foreign and U.S. SPEs. For more information on SPEs, see “Special Purpose Entities in the International Transactions Accounts.”
Direct investment by country and industry
Currently, quarterly statistics on direct investment by country and industry are published in supplemental Excel files on BEA’s website. With the annual update, these statistics will be incorporated into the standard presentation of the ITAs in the Interactive Data Application in new tables 4.5 and 6.2. Table 4.5 will present international transactions in primary income on direct investment by country and industry, and table 6.2 will present international financial transactions for direct investment by country and industry.
Additional country detail
With the annual update, ITA table 2.2, which presents seasonally adjusted trade in goods by selected countries and areas, and ITA table 3.2, which presents seasonally adjusted trade in services by selected countries and areas, will be expanded to include Australia, Belgium, Ireland, Israel, Malaysia, the Netherlands, Switzerland, and Vietnam. In addition, ITA table 2.3, which presents not seasonally adjusted trade in goods by selected countries and areas, will be expanded to include Vietnam.
* * *
Next release: June 23, 2022, at 8:30 a.m. EDT
U.S. International Transactions, First Quarter 2022 and Annual Update
* * *