Bureau of Economic Analysis
Activities of U.S. Multinational Enterprises, 2023
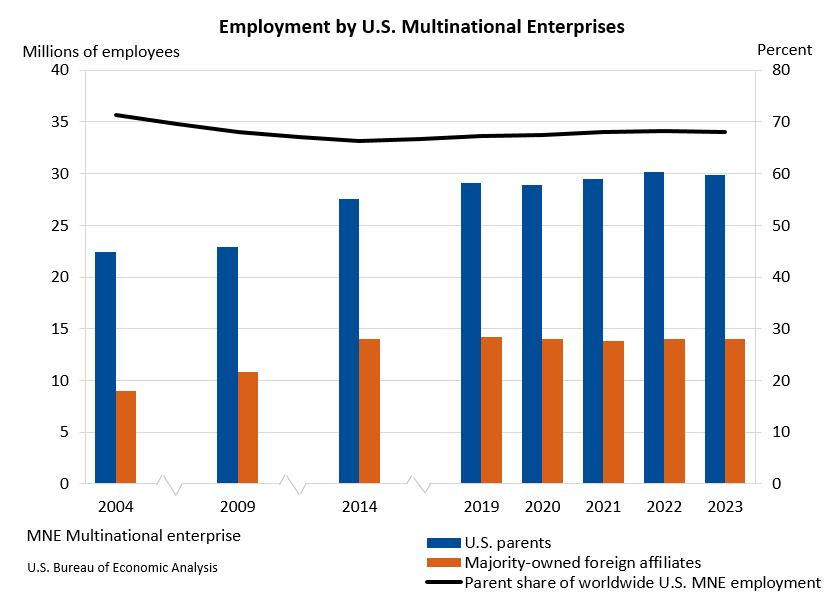
Worldwide employment by U.S. multinational enterprises decreased 0.4 percent to 43.9 million workers in 2023 (preliminary) from 44.1 million workers in 2022 (revised), according to statistics released today by the U.S. Bureau of Economic Analysis on the operations and finances of U.S. parent companies and their foreign affiliates.
Principal Federal Economic Indicators
Noteworthy
- 2025 News Release Schedule
- Innovation at BEA
- 2025 Annual Updates
- Distribution of Personal Income Nowcast
- New! Services Trade Data for More Countries
- Data Tool: Trade in Value Added
- Updated: RIMS II Regional Multipliers
- Arts and Culture
- Space Economy
- FDI Now in State BEARFACTS
- Quick Guide: Price Indexes
The Latest
GDP Increases in Third Quarter
Real gross domestic product (GDP) increased 1.9 percent in the third quarter of 2019, according to the “advance” estimate released by the Bureau of Economic Analysis. In the second quarter, real GDP increased 2.0 percent.
Gross Domestic Product, Third Quarter 2019 (Advance Estimate)
Real gross domestic product (GDP) increased 1.9 percent in the third quarter of 2019, according to the “advance” estimate released by the Bureau of Economic Analysis. In the second quarter, real GDP increased 2.0 percent.
Gross Domestic Product by Industry: Second Quarter 2019
Professional, scientific, and technical services; real estate and rental and leasing; and mining were the leading contributors to the increase in U.S. economic growth in the second quarter of 2019. The private goods‐ and services‐producing industries, as well as the government sector, contributed to the increase. Overall, 14 of 22 industry groups contributed to the 2.0 percent increase in real GDP in the second quarter.
Prototype Economic Statistics for Puerto Rico, 2012-2017
The Bureau of Economic Analysis (BEA) released for the first time prototype statistics for consumer spending, business investment, and trade in goods for Puerto Rico. These new economic data lay the groundwork for BEA to estimate the island's GDP. Currently, the annual statistics cover the time period from 2012 to 2017 and can be used to better gauge the performance of the Puerto Rico economy over that period.
Prototype Economic Statistics for Puerto Rico Now Available
Today, the Bureau of Economic Analysis released prototype statistics for personal consumption expenditures, private fixed investment, and net exports of goods for Puerto Rico. These annual statistics cover the time period from 2012 to 2017.
The estimates released today are a major step toward the goal of producing gross domestic product (GDP) statistics for Puerto Rico that are consistent with international guidelines and that are…
Gross Domestic Product for Guam, 2018
The estimates of GDP for Guam show that real GDP—GDP adjusted to remove price changes—decreased 0.3 percent in 2018 after increasing 0.2 percent in 2017. For comparison, real GDP for the United States (excluding the territories) increased 2.9 percent in 2018 after increasing 2.4 percent in 2017.
Guam GDP Decreases 0.3 Percent in 2018
The estimates of GDP for Guam show that real GDP—GDP adjusted to remove price changes—decreased 0.3 percent in 2018 after increasing 0.2 percent in 2017. For comparison, real GDP for the United States (excluding the territories) increased 2.9 percent in 2018 after increasing 2.4 percent in 2017.
U.S. International Trade in Goods and Services, August 2019
The U.S. monthly international trade deficit increased in August 2019 according to the U.S. Bureau of Economic Analysis and the U.S. Census Bureau. The deficit increased from $54.0 billion in July (revised) to $54.9 billion in August, as imports increased more than exports. The previously published July deficit was $54.0 billion. The goods deficit increased $0.8 billion in August to $74.4 billion. The services surplus decreased less than $0.1…
August 2019 Trade Gap is $54.9 Billion
The U.S. monthly international trade deficit increased in August 2019 according to the U.S. Bureau of Economic Analysis and the U.S. Census Bureau. The deficit increased from $54.0 billion in July (revised) to $54.9 billion in August, as imports increased more than exports. The previously published July deficit was $54.0 billion. The goods deficit increased $0.8 billion in August to $74.4 billion. The services…


