Bureau of Economic Analysis
Annual Update of GDP, Industry, and State Statistics Starts Sept. 25
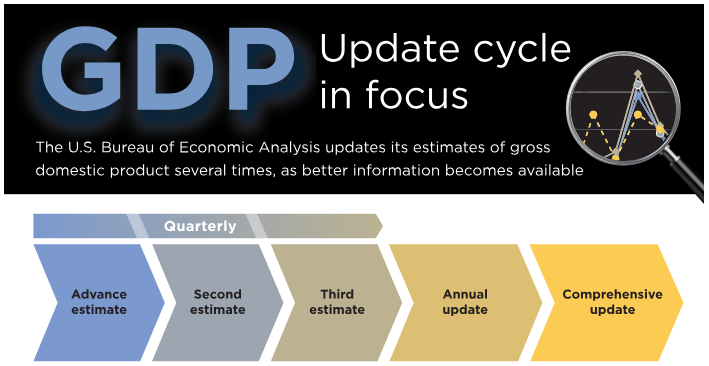
Release of the annual update of gross domestic product and related statistics, including GDP by industry, begins Sept. 25. Updates of state and county statistics start Sept. 26.
Regular annual updates enable the U.S. Bureau of Economic Analysis to refine our estimates as more complete source data become available. They are also a time to bring in improvements in methodology and presentation. This year, we'll introduce data on business investment in data centers.
Principal Federal Economic Indicators
Noteworthy
The Latest
Producto interior bruto para Puerto Rico, 2020
El producto interior bruto real para Puerto Rico decreció 6.0 por ciento en 2020, luego de crecer 0.2 por ciento en 2019, de acuerdo con las estadísticas difundidas hoy por el Negociado de Análisis Económico de EE. UU.
Direct Investment by Country and Industry, 2021
The U.S. direct investment abroad position, or cumulative level of investment, increased $403.3 billion to $6.49 trillion at the end of 2021 from $6.09 trillion at the end of 2020, according to statistics released today by the U.S. Bureau of Economic Analysis (BEA). The increase reflected a $352.6 billion increase in the position in Europe, primarily in Ireland and the United Kingdom. By industry, holding company affiliates owned by U.S.…
National, Industry, and State Annual Updates Coming Sept. 29-30
This year for the first time, BEA will produce and publish in tandem annual updates of national, industry, and state statistics. The updates on Sept. 29 and 30 will cover gross domestic product and many related statistics, including national and state personal income, for 2021 and earlier years.
May 2022 Trade Gap is $85.5 Billion
The U.S. monthly international trade deficit decreased in May 2022 according to the U.S. Bureau of Economic Analysis and the U.S. Census Bureau. The deficit decreased from $86.7 billion in April (revised) to $85.5 billion in May, as exports increased more than imports. The previously published April deficit was $87.1 billion. The goods deficit decreased $2.9 billion in May to $105.0 billion. The services surplus decreased $1.7 billion in May…
U.S. International Trade in Goods and Services, May 2022
The U.S. monthly international trade deficit decreased in May 2022 according to the U.S. Bureau of Economic Analysis and the U.S. Census Bureau. The deficit decreased from $86.7 billion in April (revised) to $85.5 billion in May, as exports increased more than imports. The previously published April deficit was $87.1 billion. The goods deficit decreased $2.9 billion in May to $105.0 billion. The services surplus decreased $1.7 billion in May to…
New Foreign Direct Investment in the United States, 2021
Expenditures by foreign direct investors to acquire, establish, or expand U.S. businesses totaled $333.6 billion (preliminary) in 2021.
New Foreign Direct Investment in the United States, 2021
Expenditures by foreign direct investors to acquire, establish, or expand U.S. businesses totaled $333.6 billion in 2021, up $192.2 billion from $141.4 billion in 2020.
Gross Domestic Product by State, 1st Quarter 2022
Real gross domestic product (GDP) decreased in 46 states and the District of Columbia in the first quarter of 2022, as real GDP for the nation decreased at an annual rate of 1.6 percent. The percent change in real GDP in the first quarter ranged from 1.2 percent in New Hampshire to –9.7 percent in Wyoming.


