Bureau of Economic Analysis
Annual Update of GDP, Industry, and State Statistics Starts Sept. 25
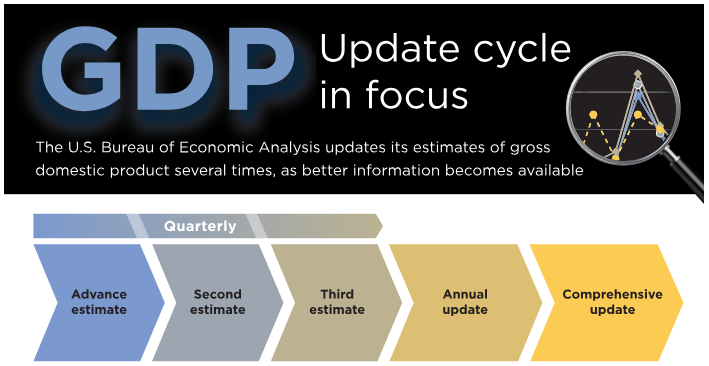
Release of the annual update of gross domestic product and related statistics, including GDP by industry, begins Sept. 25. Updates of state and county statistics start Sept. 26.
Regular annual updates enable the U.S. Bureau of Economic Analysis to refine our estimates as more complete source data become available. They are also a time to bring in improvements in methodology and presentation. This year, we'll introduce data on business investment in data centers.
Principal Federal Economic Indicators
Noteworthy
The Latest
Personal Income and Outlays, February 2022
Personal income increased $101.5 billion, or 0.5 percent at a monthly rate, while consumer spending increased $34.9 billion, or 0.2 percent, in February. The increase in personal income primarily reflected an increase in compensation of employees that was partly offset by a decrease in government social benefits. The personal saving rate (that is, personal saving as a percentage of disposable personal income) was 6.3 percent in February,…
Gross Domestic Product (Third Estimate), Corporate Profits, and GDP by Industry, Fourth Quarter and Year 2021
Real gross domestic product (GDP) increased at an annual rate of 6.9 percent in the fourth quarter of 2021, following an increase of 2.3 percent in the third quarter. The increase was revised down 0.1 percentage point from the “second” estimate released in February. The acceleration in the fourth quarter was led by an acceleration in inventory investment, upturns in exports and residential fixed investment and an acceleration in consumer…
Gross Domestic Product (Third Estimate), Corporate Profits, and GDP by Industry, Fourth Quarter and Year 2021
Real gross domestic product (GDP) increased at an annual rate of 6.9 percent in the fourth quarter of 2021, following an increase of 2.3 percent in the third quarter. The increase was revised down 0.1 percentage point from the "second" estimate released in February. The acceleration in the fourth quarter was led by an acceleration in inventory investment, upturns in exports and residential fixed investment and an acceleration in…
U.S. International Investment Position, Year 2021
The U.S. net international investment position, the difference between U.S. residents’ foreign financial assets and liabilities, was –$18.10 trillion at the end of 2021, according to statistics released today by the U.S. Bureau of Economic Analysis (BEA). Assets totaled $35.21 trillion, and liabilities were $53.31 trillion. At the end of 2020, the net investment position was –$14.01 trillion.
U.S. International Investment Position, Fourth Quarter 2021
The U.S. net international investment position, the difference between U.S. residents’ foreign financial assets and liabilities, was –$18.10 trillion at the end of the fourth quarter of 2021, according to statistics released today by the U.S. Bureau of Economic Analysis (BEA). Assets totaled $35.21 trillion, and liabilities were $53.31 trillion. At the end of the third quarter, the net investment position was –$16.35 trillion.
U.S. International Investment Position, Fourth Quarter and Year 2021
The U.S. net international investment position (IIP), the difference between U.S. residents’ foreign financial assets and liabilities, was –$18.10 trillion at the end of the fourth quarter of 2021, according to statistics released today by the U.S. Bureau of Economic Analysis (BEA). Assets totaled $35.21 trillion, and liabilities were $53.31 trillion. At the end of the third quarter, the net investment position was –$16.35 trillion.
U.S. Current-Account Deficit Widens in 2021
The U.S. current-account deficit, which reflects the combined balances on trade in goods and services and income flows between U.S. residents and residents of other countries, widened by $205.5 billion, or 33.4 percent, to $821.6 billion in 2021. The widening mostly reflected an expanded deficit on goods. The 2021 deficit was 3.6 percent of current-dollar gross domestic product, up from 2.9 percent in 2020.
U.S. Current-Account Deficit Narrows in Fourth Quarter 2021
The U.S. current-account deficit, which reflects the combined balances on trade in goods and services and income flows between U.S. residents and residents of other countries, narrowed by $2.0 billion, or 0.9 percent, to $217.9 billion in the fourth quarter of 2021. The narrowing reflected a reduced deficit on secondary income and expanded surpluses on services and on primary income that were mostly offset by an expanded deficit on goods. The…
U.S. International Transactions, Fourth Quarter and Year 2021
The U.S. current-account deficit narrowed by $2.0 billion, or 0.9 percent, to $217.9 billion in the fourth quarter of 2021, according to statistics released by the U.S. Bureau of Economic Analysis. The revised third-quarter deficit was $219.9 billion. The fourth-quarter deficit was 3.6 percent of current-dollar gross domestic product, down from 3.8 percent in the third quarter.
Personal Income by State, 2021 (Preliminary)
State personal income increased 7.4 percent in 2021 after increasing 6.6 percent in 2020. In 2021, increases in earnings, transfer receipts, and property income (dividends, interest, and rent) contributed to personal income growth in all states and the District of Columbia. The percent change in personal income across all states ranged from 9.6 percent in Idaho to 4.5 percent in Vermont.


