Bureau of Economic Analysis
Gross Domestic Product by County and Personal Income by County, 2024
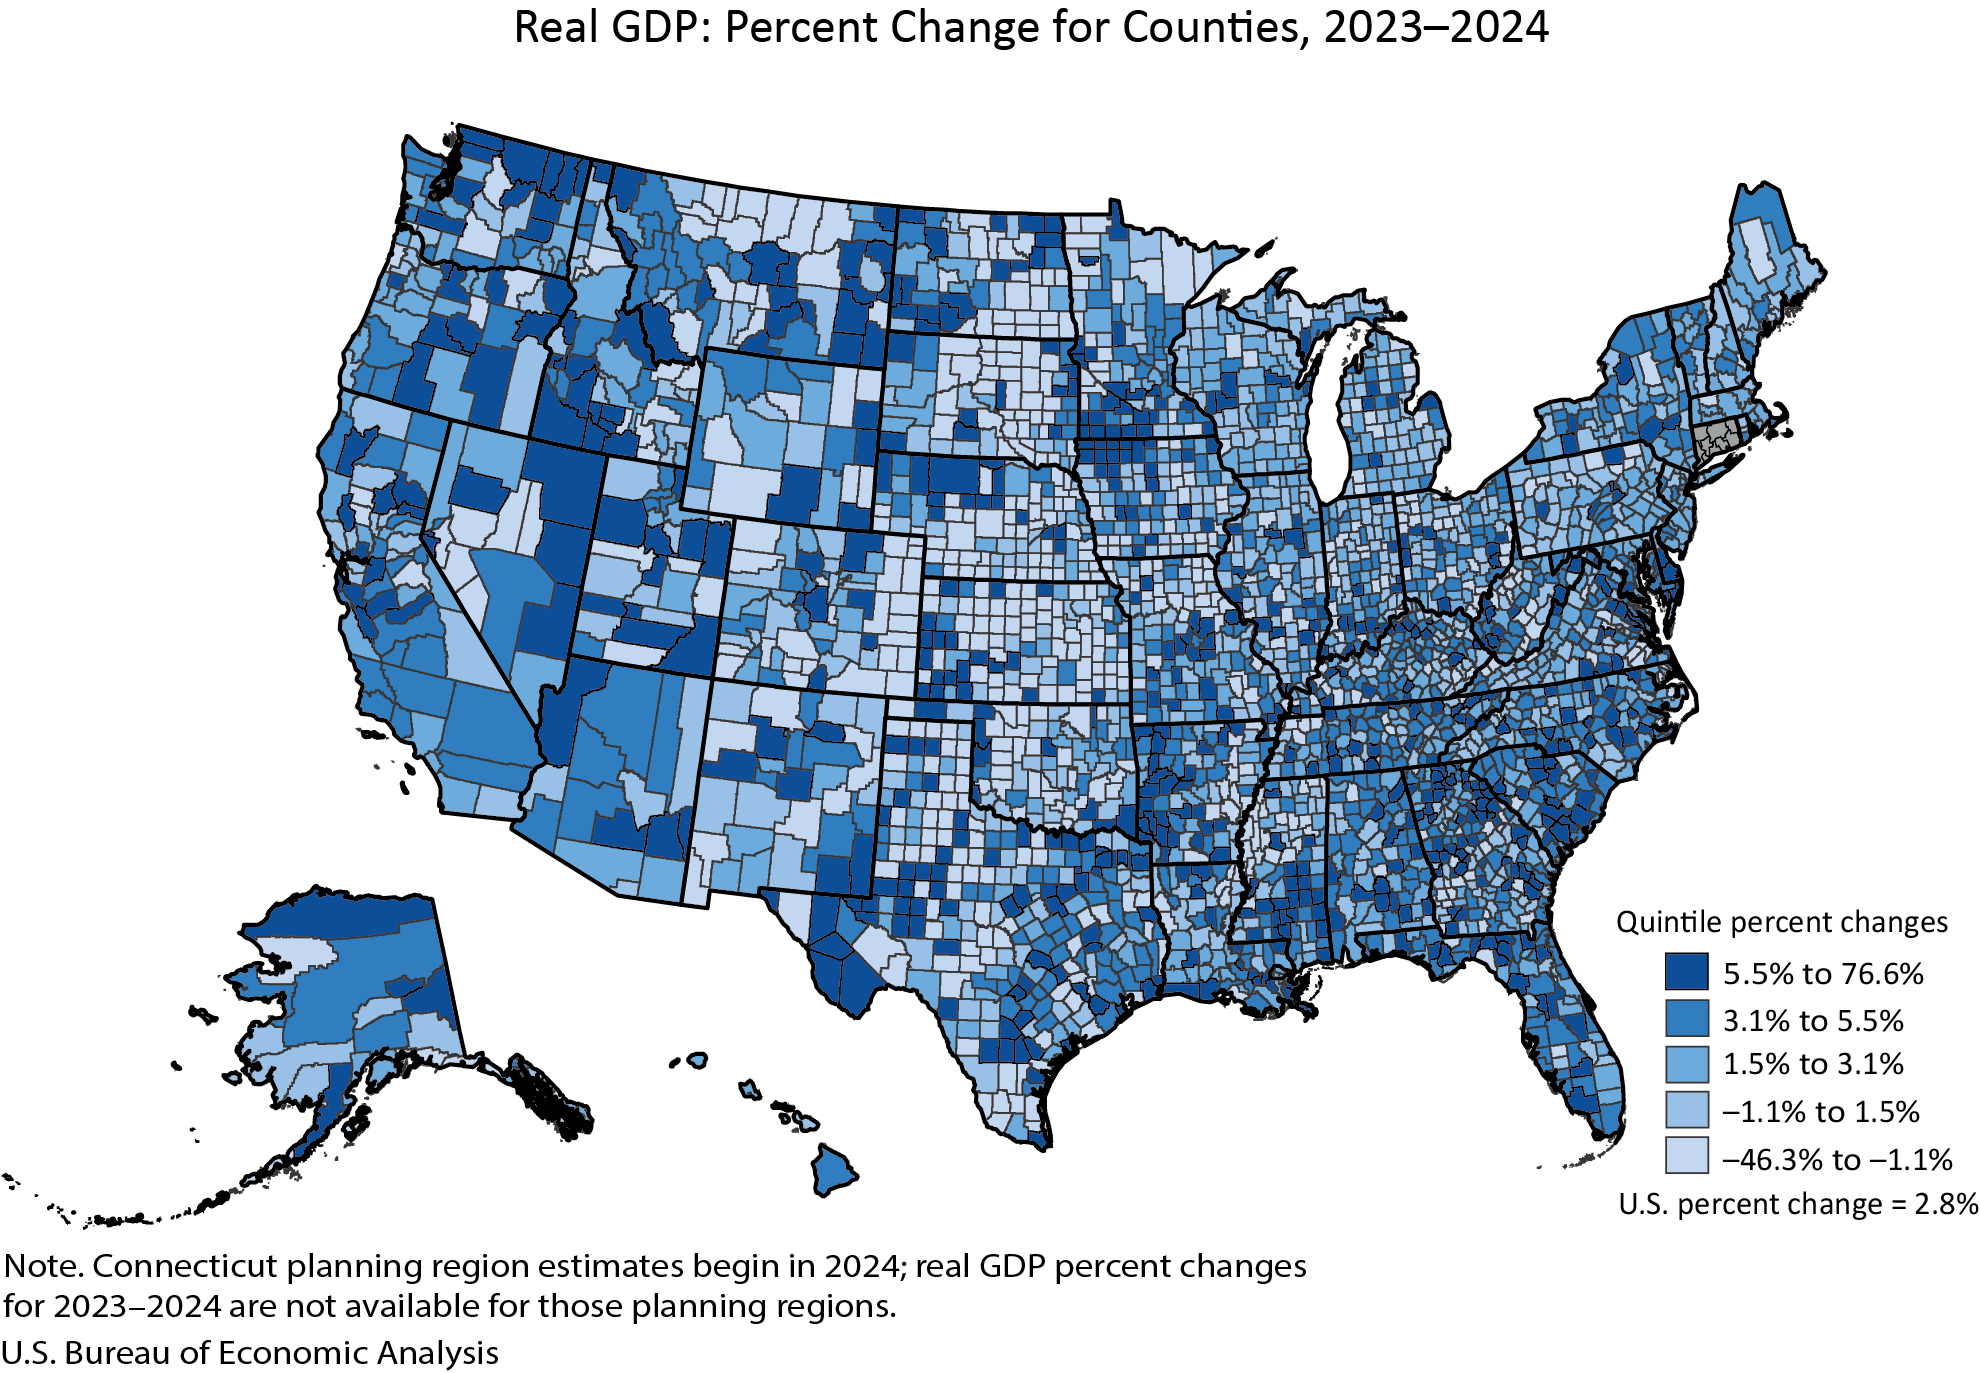
Real gross domestic product (GDP) increased in 2,273 counties, decreased in 809 counties, and was unchanged in 24 counties in 2024. County-level changes ranged from a 76.6 percent increase in Carter County, MT, to a 46.3 percent decline in Baca County, CO.
Personal income, in current dollars, increased in 2,768 counties, decreased in 331, and was unchanged in 7 counties in 2024. County-level changes ranged from a 22.6 percent increase in Harding County, SD, to a 23.3 percent decline in Issaquena County, MS.
Principal Federal Economic Indicators
Noteworthy
The Latest
Personal Income and Outlays, August 2021
Personal income increased $35.5 billion, or 0.2 percent at a monthly rate, while consumer spending increased $130.5 billion, or 0.8 percent, in August. The increase in personal income primarily reflected increases in compensation as well as government social benefits, which reflect advance Child Tax Credit payments authorized by the American Rescue Plan. In addition to presenting estimates for August 2021, these highlights provide comparisons…
Personal Income and Outlays, August 2021
Personal income increased $35.5 billion, or 0.2 percent at a monthly rate, while consumer spending increased $130.5 billion, or 0.8 percent, in August. The increase in personal income primarily reflected increases in compensation as well as government social benefits, which reflect advance Child Tax Credit payments authorized by the American Rescue Plan.
Gross Domestic Product (Third Estimate), Corporate Profits (Revised Estimate), and GDP by Industry, Second Quarter 2021
Real gross domestic product (GDP) increased at an annual rate of 6.7 percent in the second quarter of 2021, reflecting the continued economic recovery, reopening of establishments, and continued government response related to the COVID-19 pandemic. The increase was revised up 0.1 percentage point from the “second” estimate released in August. In the second quarter, government assistance payments in the form of loans to businesses and grants…
Gross Domestic Product, (Third Estimate), GDP by Industry, and Corporate Profits (Revised), 2nd Quarter 2021
Real gross domestic product (GDP) increased at an annual rate of 6.7 percent in the second quarter of 2021, reflecting the continued economic recovery, reopening of establishments, and continued government response related to the COVID-19 pandemic. The increase was revised up 0.1 percentage point from the "second" estimate released in August. In the second quarter, government assistance payments in the form of loans to businesses and…
U.S. International Investment Position, Second Quarter 2021
The U.S. net international investment position, the difference between U.S. residents’ foreign financial assets and liabilities, was –$15.42 trillion at the end of the second quarter of 2021, according to statistics released by the U.S. Bureau of Economic Analysis (BEA). Assets totaled $34.20 trillion and liabilities were $49.62 trillion. At the end of the first quarter, the net investment position was –$14.30 trillion.
U.S. International Investment Position Second Quarter 2021
The U.S. net international investment position, the difference between U.S. residents’ foreign financial assets and liabilities, was –$15.42 trillion at the end of the second quarter of 2021, according to statistics released by the U.S. Bureau of Economic Analysis. Assets totaled $34.20 trillion and liabilities were $49.62 trillion. At the end of the first quarter, the net investment position was –$14.30 trillion.
Gross Domestic Product for Puerto Rico, 2019
Real gross domestic product (GDP) increased 0.3 percent in 2019 after decreasing 2.4 percent in 2018, according to estimates released today by the Bureau of Economic Analysis (BEA). The statistics released today are BEA’s first official release of GDP for Puerto Rico. The release includes updated estimates for 2012 to 2018 that incorporate new and additional source data and methodology improvements to the prototype GDP statistics that were…
Gross Domestic Product for Puerto Rico, 2019
Real gross domestic product increased 0.3 percent in 2019 after decreasing 2.4 percent in 2018, according to estimates released today by the Bureau of Economic Analysis. The statistics released today are BEA’s first official release of GDP for Puerto Rico. The release includes updated estimates for 2012 to 2018 that incorporate new and additional source data and methodology improvements to the prototype GDP statistics that were released in…
Personal Income by State, 2nd Quarter 2021
State personal income decreased 21.8 percent at an annual rate in the second quarter of 2021 after increasing 56.9 percent in the first quarter. In the second quarter of 2021, the decrease in transfer receipts was the leading contributor to personal income declines in all 50 states and the District of Columbia. The percent change in personal income across all states ranged from -10.1 percent in the District of Columbia to -34.0 percent in West…
Personal Income by State, 2nd Quarter 2021
State personal income decreased 21.8 percent at an annual rate in the second quarter of 2021 after increasing 56.9 percent in the first quarter. In the second quarter of 2021, the decrease in transfer receipts was the leading contributor to personal income declines in all 50 states and the District of Columbia. The percent change in personal income across all states ranged from –10.1 percent in the District of Columbia to –34.0 percent in…


