Bureau of Economic Analysis
Annual Update of GDP, Industry, and State Statistics Starts Sept. 25
Release of the annual update of gross domestic product and related statistics, including GDP by industry, begins Sept. 25. Updates of state and county statistics start Sept. 26.
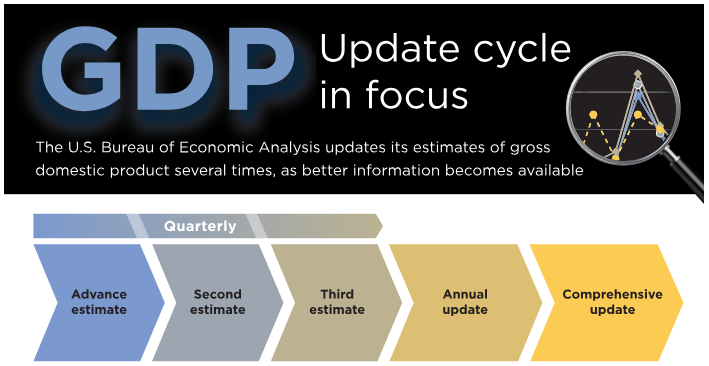
Regular annual updates enable the U.S. Bureau of Economic Analysis to refine our estimates as more complete source data become available. They are also a time to bring in improvements in methodology and presentation. This year, we'll introduce data on business investment in data centers.
Principal Federal Economic Indicators
Noteworthy
The Latest
Gross Domestic Product, First Quarter 2019 (Advance Estimate)
Real gross domestic product (GDP) increased 3.2 percent in the first quarter of 2019, according to the “advance” estimate released by the Bureau of Economic Analysis. In the fourth quarter of 2018, real GDP increased 2.2 percent.
Gross Domestic Product by Industry: Fourth Quarter 2018
Wholesale trade; mining; and information were the leading contributors to the increase in U.S. economic growth in the fourth quarter of 2018. Overall, 15 of 22 industry groups contributed to the 2.2 percent increase in real GDP in the fourth quarter.
Gross Domestic Product by Industry: Fourth Quarter and Annual 2018
Wholesale trade; mining; and information were the leading contributors to the increase in U.S. economic growth in the fourth quarter of 2018. Overall, 15 of 22 industry groups contributed to the 2.2 percent increase in real GDP in the fourth quarter.
February 2019 Trade Gap is $49.4 Billion
The U.S. monthly international trade deficit decreased in February 2019 according to the U.S. Bureau of Economic Analysis and the U.S. Census Bureau. The deficit decreased from $51.1 billion in January (revised) to $49.4 billion in February, as exports increased more than imports. The previously published January deficit was $51.1 billion. The goods deficit decreased $1.2 billion in February to $72.0 billion. The services surplus increased $0…
U.S. International Trade in Goods and Services, February 2019
The U.S. monthly international trade deficit decreased in February 2019 according to the U.S. Bureau of Economic Analysis and the U.S. Census Bureau. The deficit decreased from $51.1 billion in January (revised) to $49.4 billion in February, as exports increased more than imports. The previously published January deficit was $51.1 billion. The goods deficit decreased $1.2 billion in February to $72.0 billion. The services surplus increased $0.5…
Digital Economy Accounted for 6.9 Percent of GDP in 2017
The digital economy accounted for 6.9 percent of the U.S. gross domestic product, or $1.35 trillion, in 2017, according to a new batch of statistics released by the Bureau of Economic Analysis.
How does that compare with traditional U.S. industries? The digital economy ranked just below professional, scientific, and technical services, which accounted for 7.4 percent of GDP, and just above wholesale trade, with a 6.0 percent…
National Statistics Return to Normal Timetable in April
By the end of April, key national economic indicators will be on their original 2019 schedule, as the Bureau of Economic Analysis’ timetable of releases continues to recover from disruptions earlier in the year.
The advance, or first, estimate of gross domestic product for the first quarter will be released April 26 at 8:30 a.m., in accordance with BEA’s original calendar. The second and third estimates of first quarter GDP also…
U.S. Net International Investment Position Fourth Quarter 2018
The U.S. net international investment position decreased to −$9,717.1 billion (preliminary) at the end of the fourth quarter of 2018 from −$9,634.8 billion (revised) at the end of the third quarter. The $82.4 billion decrease reflected net financial transactions of −$199.2 billion and net other changes in position, such as price and exchange-rate changes, of $116.8 billion.
U.S. Net International Investment Position Year 2018
The U.S. net international investment position decreased to −$9,717.1 billion (preliminary) at the end of 2018 from −$7,725.0 billion at the end of 2017. The $1,992.1 billion decrease reflected net financial transactions of −$519.6 billion and net other changes in position, such as price and exchange-rate changes, of −$1,472.6 billion.
U.S. Net International Investment Position, Fourth Quarter and Year 2018
The U.S. net international investment position decreased to -$9,717.1 billion (preliminary) at the end of the fourth quarter of 2018 from -$9,634.8 billion (revised) at the end of the third quarter, according to statistics released by the Bureau of Economic Analysis (BEA).


