
Bureau of Economic Analysis
U.S. International Transactions, 3rd Quarter 2025
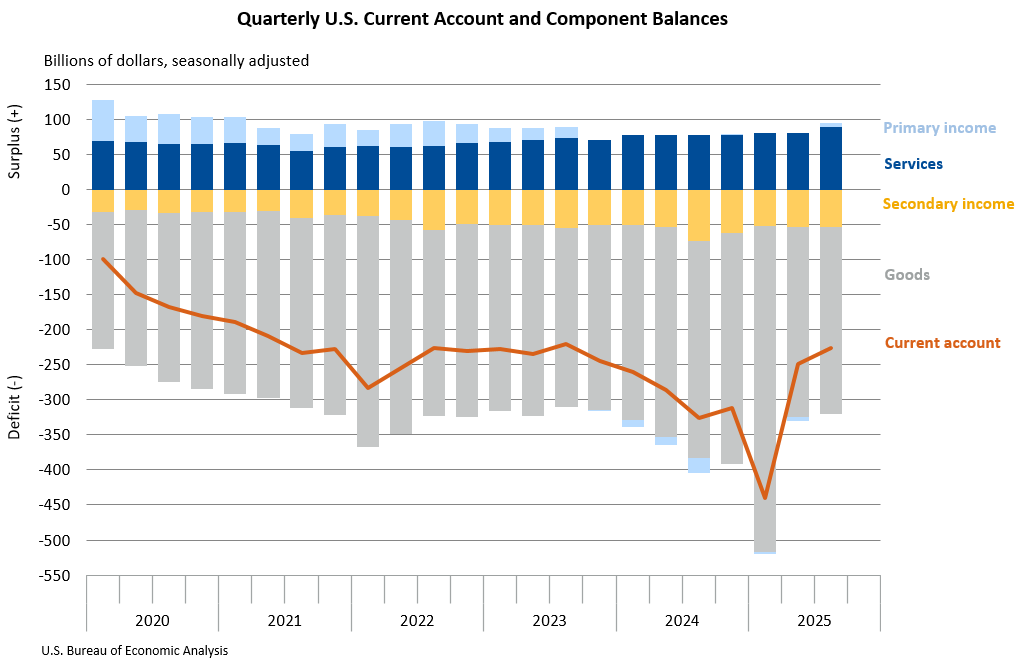
The U.S. current-account deficit narrowed by $22.8 billion, or 9.2 percent, to $226.4 billion in the third quarter of 2025, according to statistics released today by BEA. The revised second-quarter deficit was $249.2 billion. The third-quarter deficit was 2.9 percent of current-dollar gross domestic product, down from 3.3 percent in the second quarter.
Principal Federal Economic Indicators
Noteworthy


The Latest
Activities of U.S. Multinational Enterprises: 2016
Worldwide employment by U.S. multinational enterprises (MNEs) increased 0.4 percent to 42.3 million workers (preliminary) in 2016 from 42.1 million (revised) in 2015, according to statistics released by the Bureau of Economic Analysis on the operations and finances of U.S. parent companies and their foreign affiliates.
SCB Article: Results of Seasonal Adjustment Project
With its 2018 comprehensive update of gross domestic product and related statistics, the Bureau of Economic Analysis completed a multiyear project to improve and modernize our seasonal adjustment practices.
Welcome to the Updated bea.gov
We’ve made it easier to find what you’re looking for.
Our redesigned homepage features BEA’s latest news and most-watched statistics.
Use the Data menu at the top to explore data by topic or by place.
Want to dive straight into the numbers? The Tools menu takes you to our expansive Interactive Data Tables, the API, and other data tools. (They function the same as before, although they are found at the new…
June 2018 Trade Gap is $46.3 Billion
The U.S. monthly international trade deficit increased in June 2018 according to the U.S. Bureau of Economic Analysis and the U.S. Census Bureau. The deficit increased from $43.2 billion in May (revised) to $46.3 billion in June, as exports decreased and imports increased. The previously published May deficit was $43.1 billion. The goods deficit increased $3.1 billion in June to $68.8 billion. The services surplus decreased less than $0.1…
U.S. International Trade in Goods and Services, June 2018
The U.S. monthly international trade deficit increased in June 2018 according to the U.S. Bureau of Economic Analysis and the U.S. Census Bureau. The deficit increased from $43.2 billion in May(revised) to $46.3 billion in June, as exports decreased and imports increased. The previously published May deficit was $43.1 billion. The goods deficit increased $3.1 billion in June to $68.8 billion. The services surplus decreased less than $0.1 billion…
Real Disposable Income Rises in June
Personal income increased 0.4 percent in June, the same increase as in May. Wages and salaries, the largest component of personal income, increased 0.4 percent in June after increasing 0.3 percent in May.
Personal Income and Outlays, June 2018
Personal income increased 0.4 percent in June, the same increase as in May. Wages and salaries, the largest component of personal income, increased 0.4 percent in June after increasing 0.3 percent in May.
Direct Investment by Country and Industry: 2017
The U.S. direct investment abroad position, or cumulative level of investment, increased $427.3 billion to $6,013.3 billion at the end of 2017 from $5,586.0 billion at the end of 2016. The increase mainly reflected a $243.6 billion increase in the position in Europe, primarily in Switzerland, the United Kingdom, Ireland, and the Netherlands. By industry, affiliates in manufacturing and holding companies accounted for the largest increases.…
Direct Investment by Country and Industry, 2017
In 2017, the U.S. direct investment abroad position increased to $6,013.3 billion and the foreign direct investment in the United States position increased to $4,025.5 billion, according to statistics released by the Bureau of Economic Analysis (BEA). The increases were mainly due to increased investment with countries in Europe.
GDP Increases in Second Quarter
Real gross domestic product (GDP) increased 4.1 percent in the second quarter of 2018, according to the “advance” estimate released by the Bureau of Economic Analysis. In the first quarter, real GDP increased 2.2 percent (revised).